Пройти тестирование по этим заданиям
Вернуться к каталогу заданий
Версия для печати и копирования в MS Word
1
Выберите только ОДНО из двух предложенных заданий (40.1 или 40.2). Укажите его номер и выполните согласно данному плану. В ответе на задание 40 числительные пишите цифрами.
40.1 Imagine that you are doing a project on what music genres are popular. You have collected some data on the subject — the results of the opinion polls (see the table below).
Comment on the data in the table and give your personal opinion on the subject of the project.
| Music Genre | Popularity |
|---|---|
| Alternative rock music | 21.6% |
| Folk music | 21.0% |
| Rock | 13.8% |
| Pop music | 8.0% |
| Rap | 4.1% |
Write 200−250 words. Use the following plan:
— make an opening statement on the subject of the project work;
— select and report 2−3 main features;
— make 1−2 comparisons where relevant;
— outline a problem that can arise with music genres and suggest the way of solving it
— draw a conclusion giving your personal opinion on the importance of music in human life
40.2 Imagine that you are doing a project on book sales in the UK. You have collected some data on the subject (see the diagram below).
Comment on the data in the diagram and give your personal opinion on the subject of the project.

Write 200−250 words. Use the following plan:
— make an opening statement on the subject of the project work;
— select and report 2−3 main features;
— make 1−2 comparisons where relevant;
— outline a problem that can arise with book sales and suggest the way of solving it;
— draw a conclusion giving your personal opinion on the importance of reading in human life
2
Выберите только ОДНО из двух предложенных заданий (40.1 или 40.2). Укажите его номер и выполните согласно данному плану. В ответе на задание 40 числительные пишите цифрами.
40.1. Imagine that you are doing a project on what kinds of sports are popular in Russia. You have collected some data on the subject — the results of the opinion polls (see the table below).
Comment on the data in the table and give your personal opinion on the subject of the project.
| Kinds of sports | Popularity |
|---|---|
| Football | 11,2% |
| Volleyball | 10,8% |
| Basketball | 9,8% |
| Athletics | 6,7% |
Write 200−250 words. Use the following plan:
— make an opening statement on the subject of the project work;
— select and report 2−3 main features;
— make 1−2 comparisons where relevant;
— outline a problem that can arise with popular kinds of sports and suggest the way of solving it;
— draw a conclusion giving your personal opinion on the importance of sports in human life
40.2 Imagine that you are doing a project on transport preference in Japan. You have collected some data on the subject (see the diagram below).
Comment on the data in the diagram and give your personal opinion on the subject of the project.
Write 200−250 words. Use the following plan:
— make an opening statement on the subject of the project work;
— select and report 2−3 main features;
— make 1−2 comparisons where relevant;
— outline a problem that can arise with different kinds of transport and suggest the way of solving it;
— draw a conclusion giving your personal opinion on the importance of eco-friendly transport in human life
3
Выберите только ОДНО из двух предложенных заданий (40.1 или 40.2). Укажите его номер и выполните согласно данному плану. В ответе на задание 40 числительные пишите цифрами.
40.1 Imagine that you are doing a project on how long it takes people to get to school or work. You have collected some data on the subject — the results of a poll (see the table below).
Comment on the data in the table and give your personal opinion on the subject of the project.
| Time | Percentage |
|---|---|
| 1−10 minutes | 10% |
| 10−30 minutes | 28,2% |
| 30−60 minutes | 28.5% |
| 60−120 minutes | 21.7% |
| 120+ minutes | 2.9% |
Write 200−250 words. Use the following plan:
— make an opening statement on the subject of the project work;
— select and report 2−3 main features;
— make 1−2 comparisons where relevant;
— outline a problem that can arise with travelling to school or to work and suggest the way of solving it;
— draw a conclusion giving your personal opinion on the importance of commuting fast in human life
40.2 Imagine that you are doing a project on CO2 emissions in China. You have collected some data on the subject (see the diagram below).
Comment on the data in the diagram and give your personal opinion on the subject of the project.
Write 200−250 words. Use the following plan:
— make an opening statement on the subject of the project work;
— select and report 2−3 main features;
— make 1−2 comparisons where relevant;
— outline a problem that can arise with CO2 emissions and suggest the way of solving it;
— draw a conclusion giving your personal opinion on the importance of conscious approach to emissions
4
Выберите только ОДНО из двух предложенных заданий (40.1 или 40.2). Укажите его номер и выполните согласно данному плану. В ответе на задание 40 числительные пишите цифрами.
40.1 Imagine that you are doing a project on the amount of motor vehicles in the world. You have collected some data on the subject (see the table below).
Comment on the data in the table and give your personal opinion on the subject of the project.
| Country | Motor vehicles per 1000 people |
|---|---|
| USA | 816 |
| Canada | 685 |
| UK | 473 |
| Russia | 388 |
| India | 42 |
Write 200−250 words. Use the following plan:
— make an opening statement on the subject of the project work;
— select and report 2−3 main features;
— make 1−2 comparisons where relevant;
— outline a problem that can arise with the quantity of motor vehicles in the world and suggest the way of solving it
— draw a conclusion giving your personal opinion on the importance of motor vehicles
40.2 Imagine that you are doing a project on life expectancy in Russia. You have collected some data on the subject (see the diagram below).
Comment on the data in the diagram and give your personal opinion on the subject of the project.
Write 200−250 words. Use the following plan:
— make an opening statement on the subject of the project work;
— select and report 2−3 main features;
— make 1−2 comparisons where relevant;
— outline a problem that can arise with life expectancy and suggest the way of solving it;
— draw a conclusion giving your personal opinion on the importance of a high life expectancy
5
Выберите только ОДНО из двух предложенных заданий (40.1 или 40.2). Укажите его номер и выполните согласно данному плану. В ответе на задание 40 числительные пишите цифрами.
40.1 Imagine that you are doing a project on the number of movie tickets sold. You have collected some data on the subject (see the table below).
Comment on the data in the table and give your personal opinion on the subject of the project.
| Year | Tickets sold |
|---|---|
| 2018 | 1 311 323 188 |
| 2019 | 1 228 763 382 |
| 2020 | 223 592 795 |
| 2021 | 342 411 561 |
Write 200−250 words. Use the following plan:
— make an opening statement on the subject of the project work;
— select and report 2−3 main features;
— make 1−2 comparisons where relevant;
— outline a problem that can arise with movies and suggest the way of solving it;
— draw a conclusion giving your personal opinion on the importance of movies in human life
40.2 Imagine that you are doing a project on the percentage of household with computers. You have collected some data on the subject (see the diagram below).
Comment on the data in the diagram and give your personal opinion on the subject of the project.
Write 200−250 words. Use the following plan:
— make an opening statement on the subject of the project work;
— select and report 2−3 main features;
— make 1−2 comparisons where relevant;
— outline a problem that can arise with PCs and suggest the way of solving it;
— draw a conclusion giving your personal opinion on the importance of computers in human life
Пройти тестирование по этим заданиям

Самое сложное и вкусное задание на ЕГЭ по английскому – задание 38. Самым сложным оно считается, потому что очень легко неправильно описать данные, проблему и её решение и получить 0 баллов. А самым вкусным, потому что максимум за него выставляют 14 баллов – столько вы не получите больше ни за одно задание на этом экзамене.
В книге по графикам ЕГЭ найдете:
- Четкую и логичную схему подготовки ученика к написанию этого задания
- Клише для написания работы
- Разбор критериев оценивания и каждого абзаца работы
- 15 заданий в новом формате
- 30 упражнений, подготавливающих к описанию графиков + ключи
- 5 примеров работ
- Перечень ошибок, которые чаще всего приводят к потере баллов
- Инструкцию по заполнению бланка
*Материалы в книге соответствуют проектной демоверсии 2023 года и методическими рекомендациями.
Посмотреть оглавление и первые страницы ☝🏻
беру!
Для кого эта книга?
- Для преподавателей, которые начинают готовить к ЕГЭ и хотят с самого начала сделать все правильно, а не ставить эксперименты на своих учениках
- Для опытных учителей, которым нужна структурированная информация и практические задания для её закрепления, которые ученик может делать на уроке и дома
- Для учеников, которые хотят научиться писать письмо самостоятельно. Книга написана на русском языке и к ней прилагаются ключи, в которых можно проверить правильность выполнения упражнений
беру!
*Доступ к купленным материалам истекает через месяц после покупки. Поэтому СКАЧИВАЙТЕ СРАЗУ ПОСЛЕ ПРИОБРЕТЕНИЯ.
Так как в задание 40 внесли изменения в декабре 2021 года, актуальных пособий по этому формату экзамена нет ни в продаже, ни онлайн
ЗДЕСЬ вы можете приобрести другие материалы для подготовки к ОГЭ и ЕГЭ
ELTgram от Ирины Кузнецовой

Алгоритм описания графика (диаграммы, таблицы)
Готовимся к ЕГЭ по английскому языку

- Г рафики, диаграммы и таблицы содержат большое количество информации, представленной в доступном и легко понимаемом виде. Когда вы работаете с графиком или диаграммой, важно понять ее цель, т.е. каким образом подана информация, и что именно она показывает: частоту выполнения действий, процентное соотношение долей, делит что-либо на категории, показывает ли темп роста и т.д.

- С уществует множество видов диаграмм, но наиболее употребляемые из них это:
- столбиковая диаграмма ( bar graph ),
- секторная ( pie chart ),
- линейная ( line graph ).

- В нимательно прочтите задание и изучите график (диаграмму, таблицу), сконцентрируйтесь на фактах.
- В ыберите, какая информация является важной, а какую можно и опустить.

- С оставьте примерный план, в котором будет введение, основная часть и заключение. Причем, вступление и заключение – это всего два предложения: вводное предложение, как правило, описывающее, что изображено на графике (таблице, диаграмме), и одно заключительное предложение – вывод.
Примеры
- The graph (diagram) shows the rate of smoking people in …
- Figure 1 shows sales of mobile phones per month.
- This table illustrates clearly the extent to which the flora of selected islands now contain alien species, with the percentage varying between about one-quarter and two-thirds of the total number of species present.
- The table gives an example of an engineering curriculum.

- В подобного рода заданиях от вас не требуется высказывания своего мнения, таким образом нельзя употреблять слова «я думаю», «мне кажется».
- Т акже не стоит оценивать информацию, плохо это или хорошо с вашей точки зрения, не нужно объяснять возможные причины роста или падения, это лишнее.
- И спользуйте более официальный стиль.

- Н е отвлекайтесь на детали, не уходите в описание подробностей.
- Н ельзя разрозненно говорить о данных графика, диаграммы, то есть, терять главную мысль.
- Н е описывайте каждый пункт на графике отдельно (например, какие данные были в каждом году), а делайте обобщения, отмечайте тенденции, взлеты/падения и т.д.

- П одбирайте синонимы к словам, не используйте одинаковые грамматические конструкции.
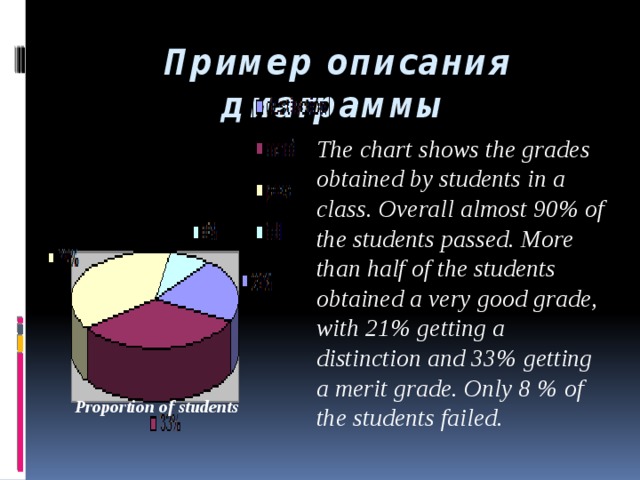
Пример описания диаграммы
The chart shows the grades obtained by students in a class. Overall almost 90% of the students passed. More than half of the students obtained a very good grade, with 21% getting a distinction and 33% getting a merit grade. Only 8 % of the students failed.
Proportion of students
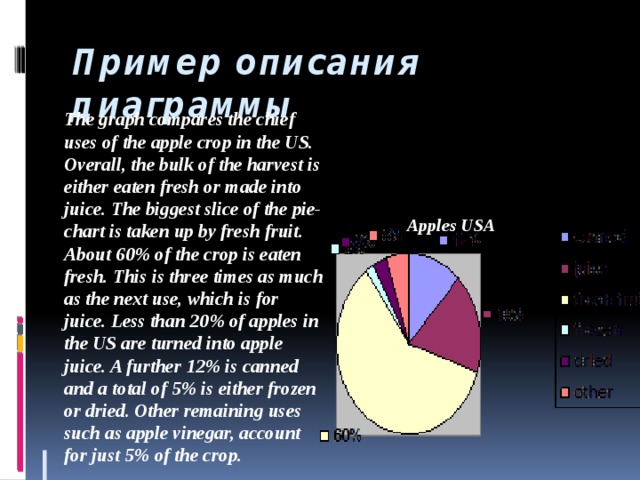
Пример описания диаграммы
The graph compares the chief uses of the apple crop in the US. Overall, the bulk of the harvest is either eaten fresh or made into juice. The biggest slice of the pie-chart is taken up by fresh fruit. About 60% of the crop is eaten fresh. This is three times as much as the next use, which is for juice. Less than 20% of apples in the US are turned into apple juice. A further 12% is canned and a total of 5% is either frozen or dried. Other remaining uses such as apple vinegar, account for just 5% of the crop.
Apples USA
GOOD
LUCK!