- Подробности
-
18185
 |
||
| Прочитайте текст с пропусками, обозначенными номерами. Эти номера соответствуют заданиям А22-А28, в которых представлены возможные варианты ответов. Обведите номер выбранного вами варианта ответа. TEST 28 ( part 3) |
Language Extinction
Language death is nowadays a phenomenon with a much more frequent A22 occurrence than the death of animals or plants species. Every two weeks, one language goes out of A23 use. Although language extinction is a natural process, it raises controversial issues A24 related to society and culture.
Linguists have defined a language as being dead the moment its last speaker passes A25 away. What causes the extinction and final death of a language? Usually, a language has higher chances to die when people speaking it are assimilated by other cultures. In this case, the language dies slowly, by merging with the language of the assimilators. Or its death can be a more accelerated process when the speakers A26 give up their own language because they don’t find any benefit in using it. Many of the dying languages have no written records, so once they go, they will be lost forever. Of course, speaking one of these languages is not seen as an asset within the business or working environment today. But it can be an asset from cultural and even scientific point of A27 view.
Preserving your own language is a proof of self-respect and of respect for your past. Learn as many foreign languages as possible, but never forget your native language just because you can’t find any benefit in using it throughout your day-by-day life. And if you are one of the few speakers of a language, contribute to getting it out of the death threat. A28 Share your knowledge with others who are interested in expanding their horizons by learning a foreign language.
|
А22 |
1) appearance появление |
2) existence существование |
3) occurrence происшествие |
4) occasion событие |
|
А23 |
1) world |
2) use Go out of use — не использоваться, перестать использоваться;устоявшееся выражение |
3) mind |
4) way |
|
А24 |
1) concerned |
2) dealing |
3) regarding |
4) related Relate to — относиться, быть связанным с чем-либо; три других слова не употребляются с TO в таком контексте |
|
А25 |
1) over Pass over — проходить; передавать |
2) away Pass away — умереть |
3) out Pass out — терять сознание |
4) off Pass off — не употребляется без дополнения |
|
А26 |
l) change |
2) break |
3) end |
4) give Give up smth — забрасывать, бросать что-либо; три других слова не могут упоребляться с UP SMTH |
|
А27 |
1) order |
2) interest |
3) view Point of view — точка зрения; устоявшееся выражение |
4) opinion |
|
А28 |
1) Share Share smth with smb — поделиться чем-либо с кем-либо; три других слова не могут быть использованы в такой конструкции |
2) Give |
3) Pass |
4) Convey |
| Languages of the United States | |
|---|---|
 |
|
| Official | None[a] |
| National | English |
| Main | English 78.5%, Spanish 13.2%, other Indo-European languages 3.7%, Asian and Pacific languages 3.5%, other languages 1.1% (2020 survey by the Census Bureau[2]) |
| Indigenous | Navajo, Cherokee, Choctaw, Muscogee, Dakota, Lakota, Western Apache, Keres, Hopi, Zuni, Kiowa, Ojibwe, O’odham[3][4]
Others Abenaki, Achumawi, Acolapissa, Adai, Afro-Seminole Creole, Alabama, Aleut, Apalachee, Aranama, Arapaho, Arikara, Assiniboine, Atakapa, Atsugewi, Awaswas, Barbareño, Bay Miwok, Biloxi, Blackfoot, Buena Vista, Caddo, Cahto, Calusa, Carolina Algonquian, Catawba, Cayuga, Cayuse, Central Kalapuya, Central Pomo, Central Sierra Miwok, Chalon, Chemakum, Cheyenne, Chickasaw, Chico, Chimariko, Chinook Jargon, Chippewa, Chitimacha, Chiwere, Chochenyo, Choctaw, Chukchansi, Coast Miwok, Coast Tsimshian, Coahuilteco, Cocopah, Coeur d’Alene, Colorado River, Columbia-Moses, Comanche, Coree, Cotoname, Cowlitz, Cree, Crow, Cruzeño, Cupeño, Eastern Pomo, Erie, Esselen, Etchemin, Eyeri, Fox, Garza, Gashowu, Gros Ventre, Gullah, Halchidhoma, Halkomelem, Hanis, Havasupai, Havasupai–Hualapai, Hawaiian Pidgin, Hidatsa, Hitchiti, Houma, Hupa, Ipai, Ivilyuat, Jicarilla, Kansa, Karankawa, Karkin, Karuk, Kashaya, Kathlamet, Kawaiisu, Kings River, Kiowa, Kitanemuk, Kitsai, Klallam, Klamath, Klickitat, Koasati, Konkow, Konomihu, Kumeyaay, Kutenai, Lake Miwok, Lipan, Louisiana Creole, Lower Tanana, Luiseño, Lummi, Lushootseed, Mahican, Maidu, Makah, Malecite-Passamaquoddy, Mandan, Maricopa, Massachusett, Mattole, Mednyj Aleut, Menominee, Mescalero-Chiricahua, Miami-Illinois, Mikasuki, Mi’kmaq, Miluk, Mitchigamea, Mobilian Jargon, Mohawk, Mohawk Dutch, Mohegan-Pequot, Mojave, Molala, Moneton, Mono, Munsee, Muscogee, Mutsun, Nanticoke, Natchez, Nawathinehena, Negerhollands, Neutral, New River Shasta, Nez Perce, Nicoleño, Nisenan, Nlaka’pamux, Nomlaki, Nooksack, Northeastern Pomo, Northern Kalapuya, Northern Paiute, Northern Pomo, Northern Sierra Miwok, Nottoway, Obispeño, Ofo, Okanagan, Okwanuchu, Omaha–Ponca, Oneida, Onondaga, Osage, Ottawa, Palewyami, Pawnee, Pennsylvania Dutch, Picuris, Piscataway, Plains Apache, Plains Cree, Plains Miwok Potawatomi, Powhatan, Purisimeño, Qawiaraq, Quapaw, Quechan, Quileute, Quinault, Quinipissa, Quiripi, Ramaytush, Rumsen, Saanich, Sahaptin, Salinan, Salish-Spokane-Kalispel, Scahentoarrhonon, Seneca, Serrano, Shasta, Shawnee, Shoshoni, Siuslaw, Solano, Southeastern Pomo, Southern Pomo, Southern Sierra Miwok, Southern Tiwa, Stoney, Susquehannock, Taensa, Taíno-Borikenaíki, Takelma, Tamyen, Tangipahoa, Taos, Tataviam, Tawasa, Tequesta, Tewa, Texas German, Tillamook, Timbisha, Timucua, Tiipai, Tolowa, Tongva, Tonkawa, Tsetsaut, Tübatulabal, Tunica, Tuscarora, Tutelo, Tututni, Twana, Umatilla, Unami, Upper Chinook, Ute, Ventureño, Virgin Islands Creole, Wailaki, Wappo, Washo, Wenrohronon, Whulshootseed, Wichita, Winnebago, Wintu, Wiyot, Woccon, Wukchumni, Wyandot, Yamasee, Yana, Yaqui, Yavapai, Yoncalla, Yuchi, Yuki, Yurok |
| Regional | Arabic, Persian, Vietnamese, Tagalog, German, French, Korean, Chinese, Russian, Ukrainian, Polish, Japanese, Italian, Greek, Hindi–Urdu, Marathi, Gujarati, Punjabi, Bengali, Tamil, Telugu, Sindhi, Lombard, Neapolitan, Louisiana Creole, New Mexican Spanish, Ahtna, Alutiiq, Carolinian, Central Alaskan Yup’ik, Central Siberian Yupik, Chamorro, Deg Xinag, Dena’ina, Eyak, Pennsylvania Dutch, Gwich’in, Haida, Hän, Hawaiian, Holikachuk, Inupiaq, Koyukon, Samoan, Tanacross, Tanana, Tlingit, Tsimshian, Upper Kuskokwim, Upper Tanana, Gullah, Virgin Islands Creole California English, New England English, New Jersey English, Southern American English, Texan English, Louisiana French |
| Vernacular | African American Vernacular English |
| Immigrant | Spoken at home by more than 1,000,000 people[5]
|
| Signed | American Sign Language, Keresan Sign Language, Navajo Family Sign, Plains Indian Sign Language, Puerto Rican Sign Language, Samoan Sign Language, Black American Sign Language, Hawaiʻi Sign Language |
| Keyboard layout |
QWERTY |
The United States does not have an official language at the federal level, but the most commonly used language is English (specifically, American English), which is the de facto national language. It is also the language spoken at home by the great majority of the U.S. population (approximately 78.5%).[6] Many other languages are also spoken at home, especially Spanish (13.2% of the population), according to the American Community Survey (ACS) of the U.S. Census Bureau; these include indigenous languages and languages brought to the U.S. by people from Europe, Africa, and Asia. However, the majority of foreign language speakers are bilingual or multilingual, and they commonly speak English. Although 21.5% of U.S. residents report that they speak a language other than English at home, only 8.2% speak English less than «very well.»[7] Several other languages, notably creoles and sign languages, have developed in the United States. Approximately 430 languages are spoken or signed by the population, of which 177 are indigenous to the area. At least fifty-two languages formerly spoken in the country’s territory are now extinct.[8]
Most common languages[edit]
Based on annual data from the American Community Survey, the United States Census Bureau regularly publishes information on the most common languages spoken at home. It also reports the English speaking ability of people who speak a language other than English at home.[9] In 2017, the U.S. Census Bureau published information on the number of speakers of over 350 languages as surveyed by the ACS from 2009 to 2013,[10][11] but it does not regularly tabulate and report data for that many languages.
According to the ACS the most common languages spoken at home by people aged five years of age or older in the period from 2017 — 2021 were:[9]
- English – 245 million (78.5%)
- Spanish – 41.3 million (13.2%)
- Chinese (including Mandarin, Cantonese, Hokkien and all other varieties) – 3.40 million (1.1%)
- Tagalog (including Filipino) – 1.72 million (0.5%)
- Vietnamese – 1.52 million (0.5%)
- Arabic – 1.39 million
- French – 1.18 million
- Korean – 1.07 million
- Russian – 1.04 million
- Portuguese – 937 thousand
- Haitian Creole – 895 thousand
- Hindi – 865 thousand
- German – 857 thousand
- Polish – 533 thousand
- Italian – 513 thousand
- Urdu – 508 thousand
- Persian (including Farsi, Dari and Tajik) – 472 thousand
- Telugu – 460 thousand
- Japanese – 455 thousand
- Gujarati – 437 thousand
- Bengali – 403 thousand
- Tamil – 341 thousand
- Punjabi – 319 thousand
- Tai–Kadai (including Thai and Lao) – 284 thousand
- Malayalam – 280 thousand
- Serbo-Croatian (including Bosnian, Croatian, Montenegrin, and Serbian) – 266 thousand
- Armenian – 256 thousand
- Greek – 253 thousand
- Hmong – 240 thousand
- Hebrew – 215 thousand
- Khmer – 193 thousand
- Navajo – 155 thousand
- other Indo-European languages – 662 thousand
- Yoruba, Twi, Igbo and other languages of West Africa – 640 thousand
- Amharic, Somali, and other Afro-Asiatic languages – 596 thousand
- Yiddish, Pennsylvania Dutch, and other West Germanic languages – 574 thousand
- Ilocano, Samoan, Hawaiian, and other Austronesian languages – 486 thousand
- Other languages of Asia – 460 thousand
- Nepali, Marathi, and other Indic languages – 448 thousand
- Ukrainian and other Slavic languages – 385 thousand
- Swahili and other languages of Central, Eastern, and Southern Africa – 288 thousand
- Malayalam, Kannada, and other other Dravidian languages – 280 thousand
- Other Native languages of North America – 169 thousand
- other and unspecified languages – 327 thousand
The ACS is not a full census but an annual sample-based survey conducted by the U.S. Census Bureau. The language statistics are based on responses to a three-part question asked about all members of a target U.S. household who are at least five years old. The first part asks if they «speak a language other than English at home.» If so, the head of the household or main respondent is asked to report which language each member speaks in the home, and how well each individual speaks English. It does not ask how well individuals speak any other language of the household. Thus, some respondents might have only a limited speaking ability of that language.[12] In addition, it is difficult to make historical comparisons of the numbers of speakers because language questions used by the U.S. Census changed numerous times before 1980.[13]
The ACS does not tabulate the number of people who report the use of American Sign Language at home, so such data must come from other sources. While modern estimates indicate that American Sign Language was signed by as many as 500,000 Americans in 1972 (the last official survey of sign language), estimates as recently as 2011 were closer to 100,000. Various cultural factors, such as the passage of the Americans with Disabilities Act, have resulted in far greater educational opportunities for hearing-impaired children, which could double or triple the number of current users of American Sign Language.
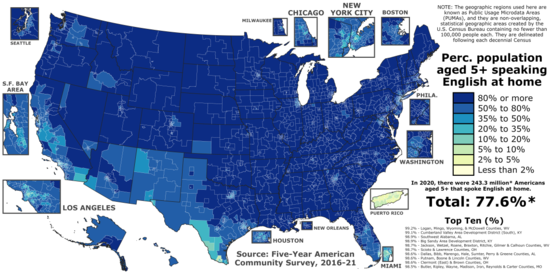
Percentage of Americans aged 5+ speaking English at home in each Public Usage Microdata Area (PUMA) of the fifty states, the District of Columbia, and Puerto Rico according to the 2016 — 2021 five-year American Community Survey
English is the most common language spoken in the United States with approximately 239 million speakers. Spanish is spoken by approximately 35 million people.[14] The United States has the world’s fourth largest Spanish-speaking population, outnumbered only by Mexico, Colombia, and Argentina; other estimates[which?] put the United States at over 50 million, second only to Mexico. Throughout the Southwestern United States and Puerto Rico, long-established Spanish-speaking communities coexist with large numbers of more recent Hispanophone immigrants. Although many new Latin American immigrants are less than fluent in English, nearly all second-generation Hispanic Americans speak English fluently, while only about half still speak Spanish.[15]
According to the 2000 U.S. Census, people of German ancestry made up the largest single ethnic group in the United States, but German language ranked fifth.[16][17] Italian, Polish, and French are still widely spoken among populations descending from immigrants from those countries in the early 20th century, but the use of these languages is dwindling as the older generations die. Russian is also spoken by immigrant populations.
Tagalog and Vietnamese have over one million speakers each in the United States, almost entirely within recent immigrant populations. Both languages, along with the varieties of Chinese (mostly Cantonese, Taishanese, and Standard Mandarin), Japanese, and Korean, are now used in elections in Alaska, California, Hawaii, Illinois, New York, Texas, and Washington.[18]
Native American languages are spoken in smaller pockets of the country, but these populations are decreasing, and the languages are almost never widely used outside of reservations. Besides English, Spanish, French, German, Navajo and other Native American languages, all other languages are usually learned from immigrant ancestors that came after the time of independence or learned through some form of education.
American Sign Language is the most common sign language in the United States although there are unrelated sign languages which have been developed in the States and territories—mostly in the Pacific. No concrete numbers exist for signers but something upwards of 250,000 is common.
Official languages[edit]

Map of U.S. official language status by state.
English declared the official language
Multiple official languages, including English (Alaska, Hawaii, South Dakota), or de facto with special status (New Mexico)
No official language specified.
The United States has never had an official language at the federal level,[19] but English is typically used at the federal level and in states without an official language. Outside of Puerto Rico, English is the primary language used for legislation, regulations, executive orders, treaties, federal court rulings, and all other official pronouncements. Nonetheless, laws require documents such as ballots to be printed in multiple languages when there are large numbers of non-English speakers in an area.
Thirty-one states, in some cases as part of what has been called the English-only movement, have adopted legislation granting official status to English.[20][21][22] Typically only «English» is specified, not a particular variety like American English. (From 1923 to 1969, the state of Illinois recognized its official language as «American».)[23][24] Hawaiian, although having few native speakers, is an official language along with English of the state of Hawaii. Alaska has made some 20 native languages official, along with English;[25][26] for example, Alaska provides voting information in English, Iñupiaq, Central Yup’ik, Gwich’in, Siberian Yupik, Koyukon, and Tagalog language.[27] On July 1, 2019, a law went into effect making Lakota, Dakota, and Nakota the official indigenous languages of South Dakota.[28]
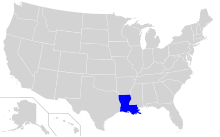
French is a de facto, but unofficial, language in Maine and Louisiana, while New Mexico law grants Spanish a special status. The government of Louisiana offers services and most documents in both English and French, and New Mexico does so in English and Spanish.
English is at least one of the official languages in all five permanently inhabited U.S. territories. In Puerto Rico both English and Spanish are official, although Spanish has been declared the principal official language. The school system and the government operate almost entirely in Spanish, but federal law requires the United States District Court for the District of Puerto Rico to use English,[29] like the rest of the federal court system. Guam recognizes English and Chamorro. In the U.S. Virgin Islands, English is the only official language. In American Samoa, both English and Samoan are officially recognized; English is common but Samoan is also seen in some official communications. In the Northern Mariana Islands, English, Chamorro, and Carolinian are official.[30][31]
In New Mexico, although the state constitution does not specify an official language, laws are published in English and Spanish, and government materials and services are legally required (by Act) to be made accessible to speakers of both languages as well as Navajo and various Pueblo languages. New Mexico also has its own dialect of Spanish, which differs from Spanish spoken in the rest of Latin America.
Algonquian, Cherokee, and Sioux are among many other Native American languages which are official or co-official on many U.S. Indian reservations and Pueblos. In Oklahoma before statehood in 1907, territory officials debated whether or not to have Cherokee, Choctaw, and Muscogee languages as co-official, but the idea never gained ground. Cherokee is officially recognized by the Cherokee Nation within the Cherokee tribal jurisdiction area in eastern Oklahoma.[32]
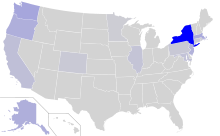
After New Amsterdam (formerly a Dutch colony) was transferred to English administration (becoming the Province of New York) in the late 17th century, English supplanted Dutch as the official language. However, «Dutch remained the primary language for many civil and ecclesiastical functions and most private affairs for the next century.»[33] The Jersey Dutch dialect is now extinct.
California has agreed to allow the publication of state documents in other languages to represent minority groups and immigrant communities. Languages such as Spanish, Chinese, Korean, Tagalog, Persian, Russian, Vietnamese, and Thai appear in official state documents, and the Department of Motor Vehicles publishes in nine languages.[34]
The issue of multilingualism also applies in the states of Arizona and Texas. While the constitution of Texas has no official language policy, Arizona passed a proposition in 2006 declaring English as the official language.[35] Nonetheless, Arizona law requires the distribution of voting ballots in Spanish, as well as indigenous languages such as Navajo, O’odham and Hopi, in counties where they are spoken.[36]
A popular urban legend called the Muhlenberg legend claims that German was almost made an official language of the United States but lost by one vote. In reality, it was a request by a group of German immigrants to have an official translation of laws into German. House speaker Frederick Muhlenberg has since become associated with the legend.[37][38][39]
| Place | English official | Other official language(s) | Note |
|---|---|---|---|
| Alabama | Yes | None | since 1990[40] |
| Alaska | Yes | Inupiaq, Siberian Yupik, Central Alaskan Yup’ik, Alutiiq, Unangax, Dena’ina, Deg Xinag, Holikachuk, Koyukon, Upper Kuskokwim, Gwich’in, Tanana, Upper Tanana, Tanacross, Hän, Ahtna, Eyak, Tlingit, Haida, Tsimshian[41][42] | |
| Arizona | Yes | None | since 2006, 1988 law ruled unconstitutional[43] |
| Arkansas | Yes | None | since 1987[40] |
| California | Yes | None | since 1986 with Proposition 63[40] |
| Colorado | Yes | None | since 1988;[40] from 1876–1990 the Colorado Constitution required laws to be published in English, Spanish, and German[44] |
| Connecticut | No | None[40] | |
| Delaware | No | None[40] | |
| Florida | Yes | None | since 1988[40] |
| Georgia | Yes | None | since 1996[40] |
| Hawaii | Yes | Hawaiian | since 1978[40] |
| Idaho | Yes | None | since 2007[40] |
| Illinois | Yes | None | since 1969; «American» was the official language 1923–1969.[40] |
| Indiana | Yes | None | since 1984[40] |
| Iowa | Yes | None | since 2002[40] |
| Kansas | Yes | None | since 2007[40] |
| Kentucky | Yes | None | since 1984[40] |
| Louisiana | No | None | French has had special status since 1968 founding of CODOFIL.[40][45] |
| Maine | No | None[40] | |
| Maryland | No | None[40] | |
| Massachusetts | Yes | None[40] | Since 2002, 1975 law ruled unconstitutional |
| Michigan | No | None[40] | |
| Minnesota | No | None[40] | |
| Mississippi | Yes | None | since 1987[40] |
| Missouri | Yes | None[40] | since 1998; 2008 Const. Amd. [46] |
| Montana | Yes | None | since 1995[40] |
| Nebraska | Yes | None | since 1920[47] |
| Nevada | No | None[40] | |
| New Hampshire | Yes | None | since 1995[40] |
| New Jersey | No | None[40] | |
| New Mexico | No | None | Spanish has had special recognition since 1912 passage of state constitution. See article. English Plus since 1989[40] |
| New York | No | None[40] | |
| North Carolina | Yes | None | since 1987[40] |
| North Dakota | Yes | None | since 1987[40] |
| Ohio | No | None[40] | |
| Oklahoma | Yes | None | since 2010. Choctaw language is official within the Choctaw Nation, Cherokee language has been official within the Cherokee and the UKB since 1991.[48] [49][50][51] |
| Oregon | No | None | English Plus since 1989[40] |
| Pennsylvania | No | None[40] | |
| Rhode Island | No | None | English Plus since 1992[40] |
| South Carolina | Yes | None | since 1987[40] |
| South Dakota | Yes | Sioux | since 1995,[40] since 2019[52] |
| Tennessee | Yes | None | since 1984[40] |
| Texas | No | None[40] | |
| Utah | Yes | None | English only from 2000–2021;[40] since 2021, the Utah code has been amended to be English official but not English only.[53] |
| Vermont | No | None[40] | |
| Virginia | Yes | None | since 1996[40] |
| Washington | No | None | English Plus since 1989[40] |
| West Virginia | Yes | None[40] | since 2016[54] |
| Wisconsin | No | None[40] | |
| Wyoming | Yes | None | since 1996[40] |
| District of Columbia | No | None[55][56] | The Language Access Act of 2004 guarantees equal access and participation in public services, programs, and activities for residents of the District of Columbia who cannot (or have limited capacity to) speak, read, or write English. Speakers of Amharic, French, Chinese, Spanish, Vietnamese and Korean receive additional accommodations.[57][58] |
| American Samoa | Yes | Samoan[59] | |
| Guam | Yes | Chamorro[60] | |
| Northern Mariana Islands | Yes | Chamorro, Carolinian[61] | |
| Puerto Rico | Yes | Spanish[62] | |
| U.S. Virgin Islands | Yes | None[63] |
Education[edit]
Bilingual education in the United States, often a different concept from language immersion or dual-language school programs, is an area of political controversy. In standard bilingual classes, the non-English language (typically Spanish or Chinese) is utilized over a period of time when students’ English-language proficiency is lacking. Otherwise the medium of instruction at almost all U.S. schools, at all levels, is English. The exceptions are in language classes such as French or German, or in general education in the territory of Puerto Rico, where Spanish is standard. English is the language of instruction in the territory of American Samoa, despite most students speaking Samoan as their native language.[64]
There are also hundreds of language immersion and dual-language schools across the United States that teach in a variety of languages, including Spanish, Hawaiian, Chomorro, French, and Mandarin Chinese (for example, the Mandarin Immersion Magnet School in Texas). However, English is a mandatory class in all these schools.
African, Asian and European languages[edit]

Some of the first European languages to be spoken in the U.S. were English, Dutch, French, Spanish, and Swedish.
From the mid-19th century on, the nation had large numbers of immigrants who spoke little or no English, and throughout the country state laws, constitutions, and legislative proceedings appeared in the languages of politically important immigrant groups. There have been bilingual schools and local newspapers in such languages as German, Ukrainian, Hungarian, Irish, Italian, Norwegian, Greek, Polish, Swedish, Romanian, Czech, Japanese, Yiddish, Hebrew, Lithuanian, Welsh, Cantonese, Bulgarian, Dutch, Portuguese and others, despite opposing English-only laws that, for example, illegalized church services, telephone conversations, and even conversations in the street or on railway platforms in any language other than English, until the first of these laws was ruled unconstitutional in 1923 (Meyer v. Nebraska).
Typically, immigrant languages tend to be lost through assimilation within two or three generations[citation needed].
Several American states & territories have also had native populations who spoke their own language prior to joining the American Union, and have maintained their original languages for centuries: examples are Alaskan Russian in Alaska, Louisiana French in Louisiana, Pennsylvania Dutch in Pennsylvania, and Puerto Rican Spanish in Puerto Rico.
Languages native to American states & territories[edit]
English[edit]

English language distribution in the United States.
English was inherited from British colonization, and it is spoken by the majority of the population. English has become increasingly common; when the United States was founded, 40% of Americans spoke English[66][better source needed]. In 2002, 87% of Americans spoke English as their first language.[67][68] It serves as the de facto national language, the language in which government business is carried out. According to the U.S. Census Bureau, 80% spoke only English at home and all but approximately 13,600,000 U.S. residents age 5 and over speak English «well» or «very well».[69]
American English is different from British English in terms of spelling (one example being the dropped «u» in words such as color/colour), grammar, vocabulary, pronunciation, and slang usage. The differences are not usually a barrier to effective communication between an American English and a British English speaker.
Some states, like California, have amended their constitutions to make English the only official language, but in practice, this only means that official government documents must at least be in English, and does not mean that they should be exclusively available only in English. For example, the standard California Class C driver’s license examination is available in 32 different languages.[70]
New England English[edit]
New England English is a variety of American English originating in the New England area.[71][72] Most of eastern and central New England once spoke the «Yankee dialect», some of whose accent features still remain in eastern New England today, such as «R-dropping» (though this feature is now receding among younger speakers).[73][74][75] Accordingly, one linguistic division of New England is into Eastern versus Western New England English, as defined in the 1939 Linguistic Atlas of New England[76] and the 2006 Atlas of North American English (ANAE). The ANAE further argues for a division between Northern versus Southern New England English, especially on the basis of the cot–caught merger and /ɑr/ fronting (applying twice, for example, in the phrase Park the car).
Spanish[edit]

Spanish language distribution in the United States.
Spanish was also inherited from colonization and is sanctioned as official in the commonwealth of Puerto Rico, where it is the general language of instruction in schools and universities. In the 50 states, the District of Columbia, and all territories except Puerto Rico, Spanish is taught as a foreign or second language. It is spoken at home in areas with large Hispanic populations: the Southwestern United States along the border with Mexico, as well as in Florida, parts of California, the District of Columbia, Illinois, New Jersey, and New York. In Hispanic communities across the country, bilingual signs in both Spanish and English may be quite common. Furthermore, numerous neighborhoods exist (such as Washington Heights in New York City or Little Havana in Miami) in which entire city blocks will have only Spanish-language signs and Spanish-speaking people.
| Year | Number of Spanish speakers | Percent of US population |
|---|---|---|
| 1980 | 11 million | 5% |
| 1990 | 17.3 million | 7% |
| 2000 | 28.1 million | 10% |
| 2010 | 37 million | 13% |
| 2012 | 38.3 million | 13% |
| 2015 | 41 million | 14% |
| Sources:[17][77][78][79] |
Younger generations of non-Hispanics in the United States choose to study Spanish as a foreign or second language in far greater numbers than other second-language options. This might be due in part to the growing Hispanic population and the increasing popularity of Latin American movies and music performed in the Spanish language. A 2009 American Community Survey (ACS) conducted by the United States Census Bureau, showed that Spanish was spoken at home by over 35 million people aged 5 or older,[80] making the United States the world’s fifth-largest Spanish-speaking community, outnumbered only by Mexico, Colombia, Spain, and Argentina.[81][82] Since then, the number of persons reported on the ACS to speak Spanish at home has increased (see table).
New Mexican Spanish[edit]
In northern New Mexico and southern Colorado, Spanish speakers have been isolated for centuries in the southern Rockies, and developed a distinct dialect of Spanish spoken nowhere else: New Mexican Spanish. The dialect features a mix of Castilian, Galician and, more recently, Mexican Spanish, as well as Pueblo loan words. New Mexican Spanish also contains a large proportion of English loan words, particularly for technological words (e.g. bos, troca, and telefón).
Speakers of New Mexican Spanish are mainly descendants of Spanish colonists who arrived in New Mexico in the sixteenth through the eighteenth centuries. During this time, contact with the rest of Spanish America was limited, and New Mexican Spanish developed on its own course. In the meantime, Spanish colonists coexisted with and intermarried with Puebloan peoples and Navajos. After the Mexican–American War, New Mexico and all its inhabitants came under the governance of the English-speaking United States, and for the next hundred years, English-speakers increased in number.
Puerto Rican Spanish[edit]
Puerto Rican Spanish is the main language and dialect of the people of Puerto Rico, as well as many people descended from Puerto Ricans elsewhere throughout the United States.
Spanglish[edit]
Spanglish is a code-switching variant of Spanish and English and is spoken in areas with large bilingual populations of Spanish and English speakers, such as along the Mexico–United States border (California, Arizona, New Mexico, and Texas), Florida, and New York City.
French[edit]

French language distribution in the United States.
French, the fourth-most-common language (when all varieties of French are combined and separate yet related languages such as Haitian Creole are counted as French), is spoken mainly by the Louisiana Creole, native French, Cajun, Haitian, and French-Canadian populations. It is widely spoken in Maine, New Hampshire, Vermont, and in Louisiana, with notable Francophone enclaves in St. Clair County, Michigan, many rural areas of the Upper Peninsula of Michigan and the northern San Francisco Bay area.[citation needed] Because of its legacy in Louisiana, that state is served by the Council for the Development of French in Louisiana (CODOFIL), the only state agency in the United States whose mission is to serve a linguistic population. In October 2018, Louisiana became the first U.S. state to join the Organisation Internationale de la Francophonie.[83]
Three varieties of French developed within what is now the United States in colonial times including Louisiana French, Missouri French, and New England French (essentially a variant of Canadian French).[84] French is the second-most-spoken language in the states of Louisiana and Maine. The largest French-speaking communities in the United States reside in Northeast Maine; Hollywood and Miami, Florida; New York City;[citation needed] certain areas of rural Louisiana; and small minorities in Vermont and New Hampshire. Many of the New England communities are connected to the dialect found across the border in Quebec or New Brunswick. More than 13 million Americans possess primary French heritage, but only 2 million speak French, or any regional creoles and variations language at home. The largest concentration of French speakers in the country is in Louisiana.
Louisiana French[edit]
Cajun language distribution in the United States.
Louisiana French (Cajun French: français de la Louisiane; Louisiana Creole: françé la lwizyàn) is an umbrella term for the dialects and varieties of the French language spoken traditionally in colonial Lower Louisiana. As of today Louisiana French is primarily used in the U.S. state of Louisiana, specifically in the southern parishes.
French is spoken across ethnic and racial lines by Louisiana French people who may identify as Cajuns or Creoles as well as Chitimacha, Houma, Biloxi, Tunica, Choctaw, Acadians, and French Indian among others.[85][86] For these reasons, as well as the relatively small influence Acadian French has had on the region, the label Louisiana French or Louisiana Regional French (French: français régional louisianais) is generally regarded as more accurate and inclusive than «Cajun French» and is the preferred term by linguists and anthropologists.[87][88][89][90] However, «Cajun French» is commonly used in lay discourse by speakers of the language and other inhabitants of Louisiana.[91]
German[edit]

German language distribution in the United States.
German was a widely spoken language in some of the colonies, especially Pennsylvania, where a number of German-speaking Protestants and other religious minorities settled to escape persecution in Europe. Another wave of settlement occurred when Germans fleeing the failure of 19th Century German revolutions emigrated to the United States. A large number of these German immigrants settled in the urban areas, with neighborhoods in many cities being German-speaking and numerous local German language newspapers and periodicals established. German farmers also took up farming around the country, including the Texas Hill Country, at this time. The language was widely spoken until the United States entered World War I.
In the early twentieth century, German was the most widely studied foreign language in the United States, and prior to World War I, more than 6%[citation needed] of American schoolchildren received their primary education exclusively in German, though some of these Germans came from areas outside of Germany proper. Currently, more than 49 million Americans claim German ancestry, the largest self-described ethnic group in the U.S., but less than 4% of them speak a language other than English at home, according to the 2005 American Community Survey.[92] The Amish speak a dialect of German known as Pennsylvania Dutch. One reason for this decline of German language was the perception during both World Wars that speaking the language of the enemy was unpatriotic; foreign language instruction was banned in places during the First World War. Unlike earlier waves, they were more concentrated in cities and integrated quickly. Another reason for the decline in German was the lack of first-generation immigrants, as immigration to the United States from Western Europe slowed following the World Wars.
There is a myth (known as the Muhlenberg Vote) that German was to be the official language of the U.S., but this is inaccurate and based on a failed early attempt to have government documents translated into German.[93] The myth also extends to German being the second official language of Pennsylvania; however, Pennsylvania has no official language. Although more than 49 million Americans claim they have German ancestors, only 1.24 million Americans speak German at home. Many of these people are either Amish and Mennonites or Germans having newly immigrated (e.g. for professional reasons).
Pennsylvania Dutch[edit]

Pennsylvania Dutch language distribution in the United States.
Pennsylvania Dutch or Pennsylvania German is a dialect of Palatine German that is traditionally spoken mainly in Pennsylvania, but that since the 19th century has spread to the Midwest (Ohio, Indiana, Iowa and other states), where many of the speakers live today. It evolved from the German dialect of the Palatinate brought over to America by the Palatine Dutch in the 1700s. Originally spoken by adherents of different Christian denominations (Lutherans, Mennonites, Amish, German Baptist Brethren, Catholics) today it is mainly spoken by Amish and Old Order Mennonites.
Texas German[edit]
Texas German is a group of High German dialects spoken by German Texans, descendants of German immigrants who settled in Texas in the mid-19th century.
Russian[edit]
Russian language distribution in the United States.
The Russian language is spoken in areas of some states, including New York, California, Washington, New Jersey, Illinois, Massachusetts, Pennsylvania, and Alaska. It is especially spoken in immigrant neighborhoods of some cities: New York City, Boston, Los Angeles, San Francisco, Philadelphia, Chicago, Seattle, Sacramento, Spokane, Miami, Vancouver, Washington, Portland, Oregon, and Woodburn, Oregon. The Russian-American Company owned most all of what became Alaska Territory until its sale right after the Crimean War. The presence of Russian speakers in the United States had always been limited, especially after the assassination of the Romanov dynasty of tsars. Starting in the 1970s and continuing until the mid-1990s, however, many Russian-speaking people from the Soviet Union and later its constituent republics such as Russia, Moldova, Ukraine, Belarus, and Uzbekistan have immigrated to the United States, increasing the use of Russian in the country.
The largest Russian-speaking neighborhoods in the United States are found in Brooklyn, Queens, and Staten Island in New York City (specifically the Brighton Beach area of Brooklyn); parts of Los Angeles, particularly West Los Angeles and West Hollywood; parts of Philadelphia, particularly the Far Northeast; and parts of Miami like Sunny Isles Beach.
The Russian-language media group Slavic Voice of America, based in Dallas, Texas, serves Russian-speaking Americans.
Alaskan Russian[edit]
Alaskan Russian, known locally as Old Russian, is a dialect of Russian influenced by the Alutiiq language spoken by Alaskan Creoles. Most of its speakers live on Kodiak Island and in the Ninilchik (Kenai Peninsula). It has been isolated from other varieties of Russian for over a century.[94]
Kodiak Russian was natively spoken along the Afognak Strait until the Great Alaskan earthquake and tsunami of 1964. It has become moribund, spoken by only a handful of elderly people, and is virtually undocumented.[95]
Ninilchik Russian has been better studied and is more vibrant, though it is now also moribund. It developed from the Russian colonial settlement of the village of Ninilchik in 1847.[96][97]
Ninilchik Russian vocabulary is clearly Russian, with a few borrowings from English and Alaskan native languages.
In Nikolaevsk, Alaska, 66.57% of the population still spoke Russian at home as late as 2017.[98]
Indigenous languages[edit]
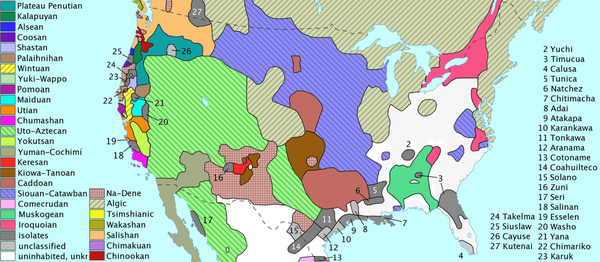
Map showing language families of the US prior to European settlement.
Native American languages[edit]
Native American languages predate European settlement of the New World. In a few parts of the U.S. (mostly on Indian reservations), they continue to be spoken fluently. Most of these languages are endangered, although there are efforts to revive them. Normally the fewer the speakers of a language the greater the degree of endangerment, but there are many small Native American language communities in the Southwest (Arizona and New Mexico) which continue to thrive despite their small size.
In 1929, speaking of indigenous Native American languages, linguist Edward Sapir observed:[99]
Few people realize that within the confines of the United States there is spoken today a far greater variety of languages … than in the whole of Europe. We may go further. We may say, quite literally and safely, that in the state of California alone there are greater and more numerous linguistic extremes than can be illustrated in all the length and breadth of Europe.
Navajo[edit]
According to the 2000 Census and other language surveys, the largest Native American language-speaking community by far is the Navajo. Navajo is an Athabaskan language of the Na-Dené family, with 178,000 speakers, primarily in the states of Arizona, New Mexico, and Utah. Altogether, Navajo speakers make up more than 50% of all Native American language speakers in the United States. Western Apache, with 12,500 speakers, also mostly in Arizona, is closely related to Navajo but not mutually intelligible with it. Navajo and other Athabaskan languages in the Southwest are relative outliers; most other Athabascan languages are spoken in the Pacific Northwest and Alaska. Navajo has struggled to keep a healthy speaker base, although this problem has been alleviated to some extent by extensive education programs on the Navajo Nation, including a Navajo language immersion school in Fort Defiance, Arizona.
Cherokee[edit]

Cherokee language distribution of the United States
Cherokee is the Iroquoian language spoken by the Cherokee people, and the official language of the Cherokee Nation.[100] Significant numbers of Cherokee speakers of all ages[101] still populate the Qualla Boundary in Cherokee, North Carolina and several counties within the Cherokee Nation of Oklahoma, significantly Cherokee, Sequoyah, Mayes, Adair, and Delaware. Increasing numbers of Cherokee youth are renewing interest in the traditions, history, and language of their ancestors.[101] Cherokee-speaking communities stand at the forefront of language preservation, and at local schools, all lessons are taught in Cherokee and thus it serves as the medium of instruction from pre-school on up.[100] Also, church services and traditional ceremonial stomp dances are held in the language in Oklahoma and on the Qualla Boundary in North Carolina.[100]
Cherokee is one of the few, or perhaps the only, Native American language with an increasing population of speakers,[102] and along with Navajo it is the only indigenous American language with more than 50,000 speakers,[103] a figure most likely achieved through the tribe’s 10-year long language preservation plan involving growing new speakers through immersion schools for children,[104][105] developing new words for modern phrases, teaching the language to non-Cherokees in schools and universities,[106] fostering the language among young adults so their children can use that language at home, developing iPhone and iPad apps for language education, the development of Cherokee language radio stations including Cherokee Voices, Cherokee Sounds,[107] and promoting the writing system through public signage, products like the Apple iPhone, internet use through Google including Gmail, and others so the language remains relevant in the 21st century.
Other Native American languages[edit]
Dakota is a Siouan language with 18,000 speakers in the US alone (22,000 including speakers in Canada), not counting 6,000 speakers of the closely related Lakota. Most speakers live in the states of North Dakota and South Dakota. Other Siouan languages include the closely related Winnebago, and the more distant Crow, among others.
Central Alaskan Yup’ik is an Eskimo–Aleut language with 16,000 speakers, most of whom live in Alaska. The term «Yupik» is applied to its relatives, which are not necessarily mutually intelligible with Central Alaskan, including Naukan and Central Siberian, among others.
The O’odham language, spoken by the Pima and the Tohono O’odham, is a Uto-Aztecan language with more than 12,000 speakers, most of whom live in central and southern Arizona and northern Sonora. Other Uto-Aztecan languages include Hopi, Shoshone, and the Pai-Ute languages.
Choctaw has 11,000 speakers. Choctaw is part of the Muskogean family, like Seminole and Alabama.
The Algonquian language family includes languages like Chippewa/Ojibwe, Cheyenne, and Cree.
Keres has 11,000 speakers in New Mexico and is a language isolate. The Keres pueblo people are the largest of the Pueblo nations. The Keres pueblo of Acoma is the oldest continually inhabited community in the United States. Zuni, another isolate, has around 10,000 speakers, most of whom reside within the Zuni pueblo.
Because of immigration from Mexico, there are Mexican native American languages speakers in the US. There are thousands of Nahuatl, Mixtec, Zapotec and Trique speakers in communities established mainly in the southern states.
Although the languages of the Americas have a history stretching back about 17,000 to 12,000 years, current knowledge of them is limited. There are doubtlessly a number of undocumented languages that were once spoken in the United States that are missing from historical record.
List of Native American languages[edit]
Below is an estimate of Native American languages «spoken at home» in the United States (American Community Survey 2006–2008).[108] This is not an exhaustive list of Native American languages in the US. Because the distinction between dialect and language isn’t always clear, multiple dialects of varying mutual intelligibility may be classified as a single language, while a group of effectively identical dialects may be classified separately for historical or cultural reasons. Languages included here may be classified as «extinct» (having no living native speakers), but many extinct or moribund Native American languages are the subjects of ongoing language revitalization efforts; other extinct languages undergoing revitalization might not be listed here.
| Language | Endonym[109] | Family | Speakers (% of total) |
Does not speak English «Very Well»[110] |
|---|---|---|---|---|
| Total | — | — | 444,124 (100) | 19.22% |
| Total (excl. Navajo) | — | — | 203,127 (54.32) | 15.82% |
| Navajo | Diné bizaad | Na-Dené | 170,822 (45.68) | 23.25% |
| Dakota | Dakȟótiyapi | Siouan | 18,804 (5.03) | 9.86% |
| Yupik | — | Eskimo–Aleut | 18,626 (4.98) | 37.02% |
| O’odham | — | Uto-Aztecan | 15,123 (3.59) | 8.03% |
| Apache | Ndee biyati’ | Na-Dené | 14,012 (3.75) | 3.53% |
| Keres | — | Isolate | 13,073 (3.50) | 6.20% |
| Cherokee | Tsalagi Gawonihisdi (ᏣᎳᎩ ᎦᏬᏂᎯᏍᏗ) | Iroquoian | 12,320 (3.29) | 16.33% |
| Choctaw | Chahta’ | Muskogean | 10,368 (2.77) | 23.44% |
| Zuni | Shiwi’ma | Isolate | 9432 (2.52) | 14.22% |
| American Indian (Other) | — | — | 8888 (2.38) | 16.73% |
| O’odham (Pima) | Oʼodham ñiʼokĭ | Uto-Aztecan | 8190 (2.19) | 14.70% |
| Ojibwe (Chippewa) | Anishinaabemowin | Algic | 6986 (1.87) | 11.28% |
| Hopi | Hopilàvayi | Uto-Aztecan | 6776 (1.81) | 18.80% |
| Inupiat (Inupik) | Iñupiatun | Eskimo–Aleut | 5580 (1.49) | 26.04% |
| Tewa | — | Tanoan | 5123 (1.37) | 13.80% |
| Muskogee (Creek) | Mvskoke | Muskogean | 5072 (1.36) | 19.62% |
| Crow | Apsáalooke | Siouan | 3962 (1.06) | 6.59% |
| Shoshoni | Sosoni’ da̲i̲gwape | Uto-Aztecan | 2512 (0.67) | 7.25% |
| Cheyenne | Tsėhésenėstsestȯtse | Algic | 2399 (0.64) | 3.21% |
| Tiwa | — | Tanoan | 2269 (0.61) | 3.22% |
| Towa (Jemez) | — | Tanoan | 2192 (0.59) | 27.65% |
| Inuit (Eskimo) | — | Eskimo–Aleut | 2168 (0.58) | 25.46% |
| Blackfoot | Siksiká (ᓱᖽᐧᖿ) | Algic | 1970 (0.53) | 11.02% |
| Sahaptin | Ichishkíin sɨ́nwit | Plateau Penutian | 1654 (0.44) | 6.17% |
| Paiute | — | Uto-Aztecan | 1638 (0.44) | 11.78% |
| Athapascan | — | Na-Dené | 1627 (0.44) | 19.55% |
| Ute | Núu-‘apaghapi | Uto-Aztecan | 1625 (0.43) | 5.23% |
| Southern Tiwa | — | Tanoan | 1600 (0.42) | |
| Mohawk | Kanien’kéha’ | Iroquoian | 1423 (0.38) | 11.67% |
| Seneca | Onödowága | Iroquoian | 1353 (0.36) | 11.23% |
| Winnebago | Hocąk | Siouan | 1340 (0.36) | 6.27% |
| Kiowa | Cáuijògà | Tanoan | 1274 (0.34) | 9.58% |
| Aleut | Unangam tunuu | Eskimo–Aleut | 1236 (0.33) | 19.01% |
| Salish | — | Salishan | 1233 (0.33) | 22.87% |
| Gwich’in (Kuchin) | Gwich’in | Na-Dené | 1217 (0.33) | 25.82% |
| Kickapoo | Kiwikapawa | Algic | 1141 (0.31) | 41.72% |
| Arapaho | Hinónoʼeitíít | Algic | 1087 (0.29) | 1.20% |
| Tlingit | Lingít | Na-Dené | 1026 (0.27) | 8.19% |
| Siberian Yupik (SLI Yupik) | Sivuqaghmiistun | Eskimo–Aleut | 993 (0.27) | 39.48% |
| Passamaquoddy | Peskotomuhkat | Algic | 982 (0.26) | 6.11% |
| Comanche | Nʉmʉ tekwapʉ | Uto-Aztecan | 963 (0.26) | 10.59% |
| Cree | Nēhiyawēwin | Algic | 951 (0.25) | 8.73% |
| Menominee | Omāēqnomenew | Algic | 946 (0.25) | 39.64% |
| Nez Perce | Niimiipuutímt | Plateau Penutian | 942 (0.25) | 12.10% |
| Potawatomi | Bodéwadmi | Algic | 824 (0.22) | 9.95% |
| Hidatsa | Hidatsa | Siouan | 806 (0.22) | 4.47% |
| Kickapoo | — | Algic | 800 (0.22) | |
| Mesquakie (Fox) | Meshkwahkihaki | Algic | 727 (0.19) | 22.15% |
| Karok | Káruk | Isolate | 700 (0.19) | 5.43% |
| Pomo | — | Pomoan | 648 (0.17) | 14.81% |
| Oneida | Oneyota’aaka | Iroquoian | 527 (0.14) | 58.63% |
| Yurok | Puliklah | Algic | 491 (0.13) | 1.63% |
| Cocopah | Kwikapa | Yuman | 483 (0.13) | 22.77% |
| Hualapai | Hwalbáy | Yuman | 458 (0.12) | 4.80% |
| Omaha | Umoⁿhoⁿ | Siouan | 457 (0.12) | 1.97% |
| Chiricahua | Ndee bizaa | Na-Dené | 457 (0.12) | — |
| Jicarilla | Abáachi mizaa | Na-Dené | 455 (0.12) | 14.51% |
| Yaqui | Yoem noki | Uto-Aztecan | 425 (0.11) | 10.12% |
| Yokuts | — | Yokutsan | 407 (0.11) | 27.27% |
| Koasati | Coushatta | Muskoeaen | 370 (0.10) | — |
| Mono | Mono | Uto-Aztecan | 349 (0.09) | — |
| Mohave | Hamakhav | Yuman | 330 (0.09) | 6.36% |
| Luiseño | Cham’teela | Uto-Aztecan | 327 (0.09) | 4.28% |
| Shawnee | Sawanwa | Algic | 321 (0.09) | 6.23% |
| Maidu (NE Maidu) | Májdy | Maiduan | 319 (0.09) | 6.90% |
| Ottawa | Nishnaabemwin | Algic | 312 (0.08) | 10.90% |
| Algonquin | Anicinâbemowin | Algic | 288 (0.08) | 19.79% |
| Okanogan | Nsəlxcin | Salishan | 284 (0.08) | 10.92% |
| Osage | Wazhazhe ie | Siouan | 260 (0.07) | 20.38% |
| Wichita | Kirikirʔi:s | Caddoan | 242 (0.06) | 16.12% |
| Onondaga | Onǫda’gegá | Iroquoian | 239 (0.06) | 2.93% |
| Mi’kmaq (Micmac) | Míkmawísimk | Algic | 230 (0.06) | 10.87% |
| Digueño (Ipai-Kumiai-Tipai) | — | Yuman | 228 (0.06) | 60.96% |
| Washo | Wá:šiw ʔítlu | Isolate | 227 (0.06) | 9.69% |
| Miwok | Miwok | Utian | 216 (0.06) | — |
| Lushootseed (Puget Salish) | Xʷəlšucid | Salishan | 207 (0.06) | 47.83% |
| Kutenai | Ktunaxa | Isolate | 200 (0.05) | 32.50% |
| Miccosukee | Mikisúkî | Muskogean | 188 (0.05) | 22.87% |
| Tuscarora | Ska:rù:rę’ | Iroquoian | 179 (0.05) | 10.06% |
| Makah | Qʷi·qʷi·diččaq | Wakashan | 176 (0.05) | 30.11% |
| Coeur d’Alene | Snchitsuʼumshtsn | Salishan | 174 (0.05) | — |
| Hupa | Na:tinixwe | Na-Dené | 174 (0.05) | — |
| Quechan (Yuma) | Kwtsaan | Yuman | 172 (0.05) | 31.98% |
| Miami | Myaamia | Algic | 168 (0.04) | 50.60% |
| Alabama | Albaamo innaaɬiilka | Muskogean | 165 (0.04) | 20.00% |
| Delaware | Lënape / Lunaapeew | Algic | 146 (0.04) | 25.34% |
| Clallam | Nəxʷsƛ̕ay̕əmúcən | Salishan | 146 (0.04) | 1.37% |
| Penobscot (E Abenaki) | Panawahpskek | Algic | 144 (0.04) | 5.56% |
| Yavapai | — | Yuman | 139 (0.04) | — |
| Cahuilla | Ivia | Uto-Aztecan | 139 (0.04) | — |
| Ponca | Paⁿka | Siouan | 131 (0.04) | 6.87% |
| Quinault | Kʷínaył | Salishan | 128 (0.03) | — |
| Deg Xinag (Ingalit) | Degexit’an | Na-Dené | 127 (0.03) | — |
| Pawnee | Paári | Caddoan | 122 (0.03) | 16.39% |
| Haida | X̱aat Kíl | Isolate | 118 (0.03) | 19.49% |
| Cowlitz | Stl’pulimuhkl | Salishan | 110 (0.03) | 82.73% |
| Mandan | Nų́ʔetaːre | Siouan | 104 (0.03) | 38.46% |
| Arikara | Sáhniš | Caddoan | 103 (0.03) | — |
| Klamath | Maqlaqs | Plateau Penutian | 95 (0.03) | 27.37% |
| Havasupai | Havasu’baaja | Yuman | 90 (0.02) | 52.22% |
| Chitimacha | Sitimaxa | Isolate | 89 (0.02) | 21.35% |
| Abenaki (W Abenaki) | Wôbanakiôdwawôgan | Algic | 86 (0.02) | — |
| Kwak’wala (Kwakiutl) | Kwak’wala | Wakashan | 85 (0.02) | 24.71% |
| Tututni (Rogue River) | Dotodəni | Na-Dené | 84 (0.02) | — |
| Iroquois | — | Iroquoian | 76 (0.02) | — |
| Tsimshian | Sm’algyax | Tsimshianic | 68 (0.02) | — |
| Achumawi | — | Palaihnihan | 68 (0.02) | — |
| Chiwere | Jíwere | Siouan | 60 (0.02) | — |
| Koasati | Kowassá:ti | Muskogean | 59 (0.02) | 6.78% |
| Koyukon | Denaakkʼe | Na-Dené | 58 (0.02) | 12.07% |
| Upper Chinook | Kiksht | Chinookan | 58 (0.02) | 10.34% |
| Caddo | Hasí:nay | Caddoan | 51 (0.01) | 23.53% |
| Kalapuya (Santiam) | — | Kalapuyan | 50 (0.01) | — |
| Gros Ventre (Atsina) | Ahahnelin | Algic | 45 (0.01) | — |
| Tachi | — | Yokutsan | 45 (0.01) | 57.78% |
| Maricopa | Piipaash chuukwer | Yuman | 44 (0.01) | 22.73% |
| Chumash | S.hamala | Chumashan | 39 (0.01) | 100.00% |
| Nomlaki | Nomlāqa | Wintuan | 38 (0.01) | — |
| Konkow (NW Maidu) | Koyoom k’awi | Maiduan | 32 | 100.00% |
| Tunica | Yuron | Isolate | 32 | — |
| Tonkawa | Tickanwa•tic | Isolate | 29 | — |
| Caddo | — | Caddoan | 25 | — |
| Wintu | Wintʰu:h | Wintuan | 24 | — |
| Spokane | Npoqínišcn | Salishan | 20 | 40.00% |
| Ahtna | Atnakenaege’ | Na-Dené | 18 | — |
| Columbia (Sinkiuse) | Nxaảmxcín | Salishan | 17 | — |
| Atsugewi | Atsugé | Palaihnihan | 15 | — |
| Chemehuevi | Nüwüvi | Uto-Aztecan | 15 | — |
| Abenaki | — | Algic | 14 | — |
| Northern Paiute | Numu | Uto-Aztecan | 12 | — |
| Dena’ina (Tanaina) | Dena’ina qenaga | Na-Dené | 11 | — |
| Cupeño | Kupangaxwicham | Uto-Aztecan | 11 | — |
| Nuu-chah-nulth (Nootka) | Nuučaan̓uł | Wakashan | 10 | — |
| Pawnee | Chatiks si chatiks | Caddoan | 10 | |
| Arikara | Sanish | Caddoan | 10 | |
| Alutiiq (Gulf Yupik) | Sugpiaq | Eskimo–Aleut | 8 | — |
| Kansa | Káⁿza | Siouan | 7 | — |
| Siuslaw | Šáayušła | Isolate | 6 | — |
| Cayuga | Gayogo̱hó:nǫ’ | Iroquoian | 6 | — |
| Serrano | Taaqtam | Uto-Aztecan | 5 | — |
| Tübatulabal | — | Uto-Aztecan | 5 | — |
| Yuchi | Tsoyaha | Isolate | 4 | — |
| Shasta | — | Shastan | 2 | 100.00% |
| Wukcumni | — | Yokutsan | 1 | 0.00% |
| Quapaw | — | Siouan | 1 | — |
Native American sign languages[edit]
A sign-language trade pidgin, known as Plains Indian Sign Language, Plains Standard or Plains Sign Talk, arose among the Native Americans of the plains. Each signing nation had a separate signed version of their oral language, that was used by the hearing, and these were not mutually intelligible. Plains Standard was used to communicate between these nations. It seems to have started in Texas and then spread north, through the Great Plains, as far as British Columbia. There are still a few users today, especially among the Crow, Cheyenne, and Arapaho. Unlike other sign languages developed by hearing people, it shares the spatial grammar of deaf sign languages. Through intergenerational transmission, Plains Sign Talk became a working language still in use today in some Deaf First Nations or Native American communities.
As Plains Sign Talk was so widespread and was a spectrum of dialects and accents, it probably hosted several languages under its umbrella. One is potentially Navajo Sign Language which is in use by a sole Navajo clan.
Additionally, Plateau Sign Language existed alongside Plains Sign Talk as either a trade pidgin or another language around the Columbia Plateau and surrounding regions.
Austronesian languages[edit]
Hawaiian[edit]

Hawaiian language distribution in the United States.
Hawaiian is an official state language of Hawaii as prescribed in the Constitution of Hawaii. Hawaiian has 1,000 native speakers. Formerly considered critically endangered, Hawaiian is showing signs of language renaissance. The recent trend is based on new Hawaiian language immersion programs of the Hawaii State Department of Education and the University of Hawaii, as well as efforts by the Hawaii State Legislature and county governments to preserve Hawaiian place names. In 1993, about 8,000 could speak and understand it; today estimates range up to 27,000. Hawaiian is related to the Māori language spoken by around 150,000 New Zealanders and Cook Islanders as well as the Tahitian language which is spoken by another 120,000 people of Tahiti.
Samoan[edit]
Samoan is an official territorial language of American Samoa. Samoans make up 90% of the population, and most people are bilingual.
Chamorro[edit]
Chamorro is co-official in the Mariana Islands, both in the territory of Guam and in the Commonwealth of the Northern Mariana Islands. In Guam, the indigenous Chamorro people make up about 60% of the population.
Carolinian[edit]
Carolinian is also co-official in the Northern Marianas, where only 14% of people speak English at home.
New American languages[edit]
Several distinct natural languages and pidgins have developed on American soil, after the founding of the United States as a nation, including full languages like creole and sign languages.
Angloromani[edit]
Angloromani is an English creole or mixed language spoken by Romani Americans.[111]
Chinuk Wawa or Chinook Jargon[edit]
A pidgin of 700–800 words of French, English, Cree and other Native origins is the old trade language of the Pacific Northwest. It was used extensively among both European and Native peoples of the Oregon Territory, even used instead of English at home by many pioneer families. It is estimated that around 100,000 people spoke it at its peak, between 1858 and 1900, and it was last widely used in Seattle just before World War II.[112]
Gullah[edit]
An English-African creole language spoken on the Sea Islands of South Carolina and Georgia retains strong influences of West African languages. The language is sometimes referred to as «Geechee».
Hawai’i Pidgin[edit]
The Hawai’ian English creole language, locally known as Hawaiian Pidgin, is used by locals and is considered an unofficial language of the state of Hawaii.[113]
Louisiana Creole French[edit]
A French Creole language spoken by the Louisiana Creole people of the state of Louisiana, close to Haitian Creole, Colonial French, and Cajun French (language of Acadians deported from New France after 1755 and the Grand Dérangement).
French Creole languages are spoken by millions of people worldwide, mainly in the United States, Caribbean, and Indian Ocean areas.
Sign languages[edit]
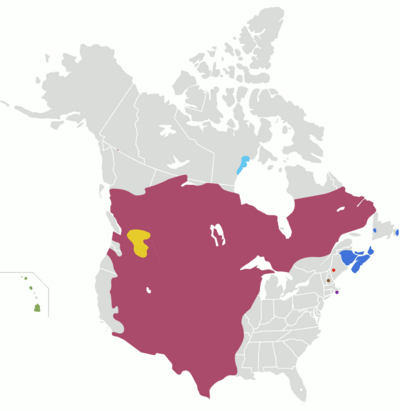
Attested historical ranges of sign languages of the US and Canada excluding ASL and LSQ.
See also: Native American sign languages
Alongside the numerous and varied oral languages, the United States also boasts several sign languages. Historically, the US was home to some six or more sign languages (that number rising with the probability that Plains Sign Talk is actually a language family with several languages under its umbrella) which has fallen with the death of several of these.
As with all sign languages around the world that developed organically, these are full languages distinct from any oral language. American Sign Language (unlike Signed English) is not a derivation of English.[114] Some languages present here were trade pidgins which were used first as a system of communication across national and linguistic boundaries of the Native Americans, however, they have since developed into mature languages as children learned them as a first language.
American Sign Language[edit]
American Sign Language (ASL) is the native language of a number of deaf and hearing people in America (roughly 100,000 to 500,000). While some sources have stated that ASL is the third most frequently used language in the United States, after English and Spanish,[115] recent scholarship has pointed out that most of these estimates are based on numbers conflating deafness with ASL use, and that the last actual study of this (in 1972) seems to indicate an upper bound of 500,000 ASL speakers at the time.[116]
- Black American Sign Language (BASL) developed in the southeastern US, where separate residential schools were maintained for white and black deaf children. BASL shares much of the same vocabulary and grammatical structure as ASL and is generally considered one of its dialects.[114][115][117]
Hawai’i Sign Language[edit]
Hawaii Sign Language is moribund with only a handful of speakers on O’ahu, Lana’i, Kaua’i and possibly Ni’ihau. Some of these speakers may actually be speaking a creolized version of HSL and ASL, however; research is slow-going. The language was once called Hawai’i Pidgin Sign Language, as many people thought it was a derivative of ASL, but it was discovered to be a separate language altogether.[118]
Plains Sign Talk[edit]
Once a trade pidgin and the most far-reaching sign language in North America, Plains Sign Talk or Plains Sign Language is now critically endangered with an unknown number of speakers.
- Navajo Sign Language has been found to be in use in one clan of Navajo; however, whether it is a dialect of Plains Sign Talk or a separate language remains unknown.[119]
- Plateau Sign Language is another trade pidgin that may have become a separate language, Plateau Sign Language replaced Plains Sign Talk in the Columbia Plateau and surrounding regions of British Columbia, Washington, Oregon, and Idaho. It is now extinct.
Martha’s Vineyard Sign Language[edit]
Martha’s Vineyard Sign Language is now extinct. Along with French Sign Language, it was one of several main contributors to American Sign Language.
Henniker Sign Language[edit]
Henniker Sign Language is now extinct but was once found around the Henniker region of New Hampshire and formed a basis for American Sign Language.
Sandy River Valley Sign Language[edit]
Sandy River Valley Sign Language is now extinct but once could be found around the Sandy River Valley in Maine. It was one of several main contributors to American Sign Language.
Immigrant languages[edit]
Arabic[edit]
Varieties of Arabic are spoken by immigrants from the Middle East as well as many Muslim Americans. The highest concentrations of native Arabic speakers reside in heavily urban areas like Chicago, New York City, and Los Angeles. Detroit and the surrounding areas of Michigan boast a significant Arabic-speaking population including many Arab Christians of Lebanese, Syrian, and Palestinian descent.
Arabic is used for religious purposes by Muslim Americans and by some Arab Christians (notably Catholics of the Melkite and Maronite Churches as well as Rum Orthodox, i.e. Antiochian Orthodox Christians and Coptic churches.). A significant number of educated Arab professionals who immigrate often already know English quite well, as it is widely used in the Middle East. Lebanese immigrants also have a broader understanding of French as do many Arabic-speaking immigrants from North Africa.[citation needed]
Chinese[edit]
The population of Chinese speakers in the United States was increasing rapidly in the 20th century because the number of Chinese immigrants has increased at a rate of more than 50% since 1940.[120] 2.8 million Americans speak some variety of Chinese, which combined are counted by the federal census as the third most-spoken language in the country. Until the late 20th century, Yue dialects, including Taishanese and Cantonese, were the most common dialects among immigrants and the descendants of immigrants, especially in California. Since the opening of the People’s Republic of China, Mandarin, the official language in the PRC and Republic of China (Taiwan), has become increasingly prevalent.[121] Many Americans of all ethnic backgrounds are also learning Mandarin and, to a far lesser extent, Cantonese.[121]
In New York City in 2002, Mandarin was spoken as a native language among only 10% of Chinese speakers but was predicted to replace Cantonese as the lingua franca among Chinese speakers.[122]
Czech[edit]
Texas Czech[edit]
12,805 Texans can speak the Czech language.[123]
Drawing on Boas’s model for interviewing speakers of the language and digitally cataloging the dialects, John Tomecek founded and Lida Cope of East Carolina University developed the Texas Czech Legacy Project at the University of Texas at Austin to document and preserve the dwindling language.[124][125][126]
Because the majority of Texas immigrants came from Moravia, the Czech spoken in Texas is largely characterized by Moravian dialects (Lachian and Moravian Wallachian) which vary to some extent from the Bohemian dialects spoken by most Czech-Americans. Czech-language journalism has been very active in the state over the years. Thirty-three newspapers and periodicals have been published. As of 1993 one weekly newspaper, Našinec, published at Granger, and one monthly, Hospodář, published at West, were still being published entirely in Czech. Other periodicals such as Věstník and the Brethren Journal contained sections printed in Czech.[127]
Dutch[edit]
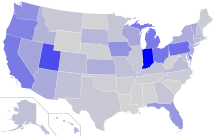
Distribution of U.S. households that speak Dutch at home
There has been a Dutch presence in America since 1602 when the government of the Republic of the Seven United Netherlands chartered the Dutch East India Company (Vereenigde Oostindische Compagnie, or VOC) with the mission of exploring for a passage to the Indies and claiming any uncharted territories for the Dutch republic. In 1664, English troops under the command of the Duke of York (later James II of England) attacked the New Netherland colony. Being greatly outnumbered, director general Peter Stuyvesant surrendered New Amsterdam, with Fort Orange following soon. New Amsterdam was renamed New York, Fort Orange was renamed Fort Albany. Dutch city names can still be found in New York’s neighbourhoods. Harlem is named after Haarlem, Staten Island is named after Staten Eiland, and Brooklyn is named after Breukelen.
In a 1990 demographic consensus, 3% of surveyed citizens claimed descent from Dutch settlers. Modern estimates place the Dutch American population at 5 million, lagging just a bit behind Scottish Americans and Swedish Americans.
Around 142,000 people in the United States still speak the Dutch language at home as of 2013, in addition to 23,000 speakers of the closely related Afrikaans.[128] They are concentrated mainly in California (23,500), Florida (10,900), Pennsylvania (9,900), Ohio (9,600), New York (8,700) and Michigan (6,600; i.e. almost entirely in the city of Holland).[129]
Jersey Dutch[edit]
A vernacular dialect of Dutch known as Jersey Dutch (extinct) was spoken by the New York & Jersey Dutch between the start of the 17th century to the mid-20th century. With the beginning of the 20th century, usage of the language became restricted to internal family circles, with an ever-growing number of people abandoning the language in favor of English. It suffered gradual decline throughout the 20th century, and it ultimately dissipated from casual usage.
Dutch was still spoken in many parts of New York at the time of the Revolution. For example, Alexander Hamilton’s wife Eliza Hamilton attended a Dutch-language church during their marriage.
African-American abolitionist and women’s rights activist Sojourner Truth (born «Isabella Baumfree») was a native speaker of Dutch.
Martin Van Buren, the first President born in the United States following its independence, spoke Dutch as his native language, making him the only President whose first language was not English.
Notable Dutch Americans include the Roosevelts (Theodore Roosevelt, Franklin Delano Roosevelt, and Eleanor Roosevelt), Marlon Brando, Thomas Alva Edison, Martin Van Buren and the Vanderbilts. The Roosevelts are direct descendants of Dutch settlers of the New Netherland colony in the 17th century.
Finnish[edit]

Finnish language distribution in the United States.
The first Finnish settlers in America were amongst the settlers who came from Sweden and Finland to the New Sweden colony. Most colonists were Finnish. However, the Finnish language was not preserved as well among subsequent generations as Swedish.
Between the 1890s and the outbreak of the first World War, an estimated quarter million Finnish citizens immigrated to the United States, mainly in rural areas of the Midwest and more specifically in the mining regions of Northeastern Minnesota, Northern Wisconsin and Michigan’s Upper Peninsula. Hancock, Michigan, as of 2005, still incorporates bi-lingual street signs written in both English and Finnish.[130][131] Americans of Finnish origin yield at 800,000 individuals, though only 26,000 speak the language at home. There is a distinctive dialect of English to be found in the Upper Peninsula, known as Yooper. Yooper often has a Finnish cadence and uses Finnish sentence structure with modified English, German, Swedish, Norwegian, and Finnish vocabulary.[citation needed]
Notable Finnish Americans include U.S. Communist Party leader Gus Hall, film director Renny Harlin, and the Canadian-born actress Pamela Anderson.
Northern Clark County, Washington (encompassing Yacolt, Amboy, Battle Ground and Chelatchie) contains a large exclave of Old Apostolic Lutherans who originally immigrated from Finland. Many families in this portion of the county speak fluent Finnish at home before learning English.[citation needed] Another noteworthy Finnish community in the United States is found in Lake Worth, Florida, north of Miami.
Hebrew[edit]
Modern Hebrew is spoken by Israeli immigrants. Liturgical Hebrew is used as a religious or liturgical language[132] by many of the United States’ approximately 7 million[133] Jews.
Gaelic Languages[edit]
About 40 million Americans have Irish ancestry, many of whose ancestors would have spoken Irish Gaelic. In 2013, around 20,600 Americans spoke Irish at home and As of 2008 it was the 76th most spoken language in the United States.[134] An additional 1,600 spoke Scottish Gaelic.[128]
Italian, Sicilian and Neapolitan[edit]
Current distribution of the Italian language in the United States.
The Italian language and other Italo-Dalmatian languages have been widely spoken in the United States for more than one hundred years, primarily due to large-scale immigration from the late 19th century to the mid 20th century.
In addition to Italian learned by most people today, there has been a strong representation of the languages of Southern Italy amongst the immigrant population (Sicilian and Neapolitan in particular). As of 2009, though 15,638,348 American citizens report themselves as Italian-Americans, only 753,992 of these report speaking the Italian language at home (0.3264% of the US population).
Khmer (Cambodian)[edit]
Between 1981 and 1985 about 150,000 Cambodians resettled in the United States.[135] Before 1975 very few Cambodians came to the United States. Those who did were children of upper-class families sent abroad to attend school. After the fall of Phnom Penh to the communist Khmer Rouge in 1975, some Cambodians managed to escape. In 2007 the American Community Survey reported that there were approximately 200,000 Cambodians living in the United States, making up about 2% percent of the Asian population. This population is, however, heavily concentrated in two areas: the Los Angeles metropolitan area in California, especially the city of Long Beach; and Greater Boston in New England, especially Lowell, Massachusetts. These two areas hold a majority of the Cambodians living in the US.
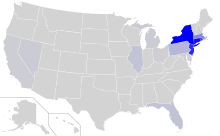
Korean[edit]
In 2011 over 1.1 million Americans spoke Korean at home. This number increased greatly at the end of the 20th century, increasing 327% from the 300,000 speakers in 1980. The greatest concentration of these speakers was in the Los Angeles, New York, and Washington D.C. metro areas.[136] Speakers of Korean are found in the Koreatowns.[citation needed]
Polish and Silesian[edit]
As of 2013, around 580,000 Americans spoke Polish at home.[128] The Polish language is very common in the Chicago metropolitan area. Chicago’s third largest white ethnic groups are those of Polish descent, after German and Irish.[137] The Polish people and the Polish language in Chicago were very prevalent in the early years of the city, and today the 650,000 Poles in Chicago make up one of the largest ethnically Polish populations in the world, comparable to the city of Wrocław, the fourth largest city in Poland. That makes it one of the most important centers of Polonia and the Polish language in the United States, a fact that the city celebrates every Labor Day weekend at the Taste of Polonia Festival in Jefferson Park.[138]
Texas Silesian[edit]
Texas Silesian, a dialect of the Silesian language (itself controversially considered a branch of Polish by some linguists), has been used by Texas Silesians in American settlements from 1852 to the present.
Portuguese[edit]
The first Portuguese speakers in America were Portuguese Jews who had fled the Portuguese Inquisition. They spoke Judeo-Portuguese and founded the earliest Jewish communities in the Thirteen Colonies, two of which still exist: Congregation Shearith Israel in New York and Congregation Mikveh Israel in Philadelphia. However, by the end of the 18th century, their use of Portuguese had been replaced by English.
In the late 19th century, many Portuguese, mainly Azoreans, Madeirans and Cape Verdeans (who prior to independence in 1975 were Portuguese citizens), immigrated to the United States, settling in cities like Providence, Rhode Island, New Bedford, Massachusetts, and Santa Cruz, California. There was also a substantial Portuguese immigration to Hawaii, which at the time was not yet part of the United States.
In the mid-late 20th century there was another wave of Portuguese immigration to the US, mainly the Northeast (New Jersey, New York, Connecticut, Massachusetts), and for a time Portuguese became a major language in Newark, New Jersey. Many Portuguese Americans may include descendants of Portuguese settlers born in Portuguese Africa (known as Portuguese Africans, or, in Portugal, as retornados) and Asia (mostly Macau). There were around 1 million Portuguese Americans in the United States by 2000. Portuguese (European Portuguese) has been spoken in the United States by small communities of immigrants, mainly in the metropolitan New York City area, like Newark, New Jersey.
The Portuguese language is also spoken widely by Brazilian Americans, concentrated in Miami, New York City, and Boston.
Swedish[edit]

Swedish language distribution in the United States.
There has been a Swedish presence in America since the New Sweden colony came into existence in March 1638.
Widespread diaspora of Swedish immigration did not occur until the latter half of the 19th century, bringing in a total of a million Swedes. No other country had a higher percentage of its people leave for the United States except Ireland and Norway. At the beginning of the 20th century, Minnesota had the highest ethnic Swedish population in the world after the city of Stockholm.
3.7% of US residents claim descent from Scandinavian ancestors, amounting to roughly 11–12 million people. According to SIL’s Ethnologue, over half a million ethnic Swedes still speak the language, though according to the 2007 American Community Survey only 56,715 speak it at home. Cultural assimilation has contributed to the gradual and steady decline of the language in the US. After the independence of the US from the Kingdom of Great Britain, the government encouraged colonists to adopt the English language as a common medium of communication, and in some cases, imposed it upon them. Subsequent generations of Swedish Americans received education in English and spoke it as their first language. Lutheran churches scattered across the Midwest started abandoning Swedish in favor of English as their language of worship. Swedish newspapers and publications alike slowly faded away.
There are sizable Swedish communities in Minnesota, Ohio, Maryland, Philadelphia, and Delaware, along with small isolated pockets in Pennsylvania, San Francisco, Fort Lauderdale, and New York. Chicago once contained a large Swedish enclave called Andersonville on the city’s north side.
John Morton, the person who cast the decisive vote leading to Pennsylvania’s support for the United States Declaration of Independence, was of Finnish descent. Finland was part of the Kingdom of Sweden in the 18th century.
Walloon[edit]
Wisconsin Walloon[edit]
Wisconsin Walloon is a dialect of the Walloon language descendant from central Walloon. It is spoken in the Door Peninsula in Wisconsin, United States.[139]
The speakers of Wisconsin Walloon are descendants of the Belgian immigrants that came from the wave of immigration lasting from 1853–1857 that was recorded to have brought around 2,000 Belgians to Wisconsin.[140] It is sometimes referred to by its speakers in English as «Belgian».[141] Descendants of native Walloon speakers have since switched to English, and as of 2021, it has fewer than 50 speakers.[139]
Welsh[edit]

Welsh language distribution in the United States.
Up to two million Americans are thought to have Welsh ancestry. However, there is very little Welsh being used commonly in the United States. According to the 2007 American Community Survey, 2,285 people speak Welsh at home; primarily spoken in California (415), Florida (225), New York (204), Ohio (135), and New Jersey (130).[142] Some place names, such as Bryn Mawr in Chicago and Bryn Mawr, Pennsylvania (English: Big Hill) are Welsh. Several towns in Pennsylvania, mostly in the Welsh Tract, have Welsh namesakes, including Uwchlan, Bala Cynwyd, Gwynedd, and Tredyffrin.
Tagalog[edit]
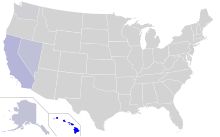
Distribution of U.S. households that speak Tagalog at home
Tagalog speakers were already present in the United States as early as the late sixteenth century as sailors contracted by the Spanish colonial government. In the eighteenth century, they established settlements in Louisiana, such as Saint Malo. After the American annexation of the Philippines, the number of Tagalog speakers steadily increased, as Filipinos began to migrate to the U.S. as students or contract laborers. Their numbers, however, decreased upon Philippine independence, as some Filipinos were repatriated.
Today, Tagalog, together with its standardized form Filipino, is spoken by over a million and a half Filipino Americans and is promoted by Filipino American civic organizations and Philippine consulates. As Filipinos are the second largest Asian ethnic group in the United States, Tagalog is the second most spoken Asian language in the country, after Chinese. Taglish, a form of code-switching between Tagalog and English, is also spoken by a number of Filipino Americans.
Tagalog is also taught at some universities where a significant number of Filipinos exist. As it is the national and most spoken language of the Philippines, most Filipinos in the United States are proficient in Tagalog in addition to their local regional language.
Vietnamese[edit]

Vietnamese language distribution in the United States
According to the 2010 Census, there are over 1.5 million Americans who identify themselves as Vietnamese in origin, ranking fourth among the Asian American groups and forming the largest Overseas Vietnamese population.
Orange County, California, is home to the largest concentration of ethnic Vietnamese outside Vietnam, especially in its Little Saigon area. Other significant Vietnamese communities are found in the metropolitan areas of San Jose, Houston, Dallas-Fort Worth, Seattle, Northern Virginia, and New Orleans. Similarly to other overseas Vietnamese communities in Western countries (except France), the Vietnamese population in the United States was established following the Fall of Saigon in 1975 and communist takeover of South Vietnam following the Vietnam War.
Yiddish[edit]
Yiddish has a much longer history in the United States than Hebrew.[143] It has been present since at least the late 19th century and continues to have roughly 148,000 speakers as of the 2009 American Community Survey. Though they came from varying geographic backgrounds and nuanced approaches to worship, immigrant Jews of Central Europe, Germany and Russia were often united under a common understanding of the Yiddish language once they settled in America, and at one point dozens of publications were available in most East Coast cities. Though it has declined by quite a bit since the end of WWII, it has by no means disappeared. Many Israeli immigrants and expatriates have at least some understanding of the language in addition to Hebrew, and many of the descendants of the great migration of Ashkenazi Jews of the past century pepper their mostly English vocabulary with some loan words. Furthermore, it is a lingua franca among American Jews (particularly Hasidic Jewry), concentrated in Los Angeles, Miami, and New York.[144] A significant diffusion of Yiddish loan words into the non-Jewish population continues to be a distinguishing feature of New York City English. Some of these words include glitch, chutzpah, mensch, kvetch, etc.
South Asian languages[edit]
There are many South Asians in the United States. These include Indians, Pakistanis, and Bangladeshis, who speak various South Asian languages. Major South Asian languages spoken in the US include Telugu (see «Telugu» below), Malayalam, Kannada, Tamil (see «Tamil» below), Gujarati, Hindi and Urdu (see ‘Hindi-Urdu» below), Bengali, Punjabi, Sinhala, Nepali (see «Nepali» below), and Marathi.
Hindi and Urdu[edit]
Hindi and Urdu are the two standard registers of the Hindustani language, an Indo-Aryan language native to North India, Central India, and Pakistan. While the formal registers draw vocabulary from Sanskrit and Arabic & Persian respectively, the colloquial forms are indistinguishable. Hindi and Urdu are widely spoken among the Indian and Pakistani communities in the United States as a first or second language. Speakers are concentrated in states with large South Asian populations, including California, Illinois, New Jersey, New York, Texas, and Virginia.[145]
Additionally, Hindi-Urdu (Hindustani) is an important cultural language for many South Asians who have different mother tongues and dialects. Bollywood in particular, as well as film music, is an important cultural product that influences many South Asian youth. Some South Indians, Bangladeshis, and Indian Bengalis learn the language or its dialects through films.[146][147]
Nepali[edit]
The first Nepalese to enter the United States were classified as «other Asian». Immigration records show that between 1881 and 1890, 1,910 «other Asians» were admitted to the United States. However, Nepal did not open its borders until 1950, and most Nepalis who left the country during that time went primarily to India to study. Nepalese Americans were first classified as a separate ethnic group in 1974 when 56 Nepalese immigrated to the United States. New York City, Boston, Dallas-Fort Worth, Columbus, Los Angeles, Cincinnati, Erie, Harrisburg, Chicago, Denver, Gainesville, Portland, and Saint Paul have the largest number of Nepalese. There are some Nepalese community or cultural events in every American state, including Dashain, Tihar, Losar, Holi, Teej Special, and Nepali New Year.
Tamil[edit]
The Tamil community in the United States is largely bilingual. Tamil is taught in weekly classes in many Hindu temples and by associations such as the American Tamil Academy in South Brunswick, Tamil Jersey School in Jersey City, New Jersey,[148]
The written form of the language is highly formal and quite distinct from the spoken form. A few universities, such as the University of Chicago and the University of California Berkeley, have graduate programs in the language.[149]
In the second half of the 20th century, Tamils from India migrated as skilled professionals to the United States, Canada, Europe, and Southeast Asia. The Tamil American population numbers over 195,685 individuals,[150] and the Federation of Tamil Sangams of North America functions as an umbrella organization for the growing community.[151]
The New York City and Los Angeles metropolitan areas are home to the largest concentrations of Tamil-speaking Sri Lankan Americans.[152][153][154] New York City’s Staten Island alone is estimated to be home to more than 5,000 Sri Lankan Americans,[155] one of the largest Sri Lankan populations outside Sri Lanka itself,[156] and a significant proportion of whom speak Tamil.

Central New Jersey is home to the largest population concentration of Tamils. New Jersey houses its own Tamil Sangam.[157] Sizeable populations of Indian American Tamils have also settled in the New York City and Washington metropolitan areas, as well as on the West Coast in Silicon Valley, where there are Tamil associations such as the Bay Area Tamil Mandram.[158] The New York City and Los Angeles metropolitan areas are home to the largest concentrations of Tamil-speaking Sri Lankan Americans,[159][160][161] with New York City’s Staten Island alone estimated to be home to more than 5,000 Sri Lankan Americans,[155] one of the largest Sri Lankan populations outside Sri Lanka itself,[162] and a significant proportion of whom speak Tamil.
Telugu[edit]

There were 171,000 speakers of Telugu in 2006–2008.[163]
In the second half of the 20th century, Telugu people from India (especially from Andhra Pradesh, Telangana, Karnataka and Tamil Nadu) migrated as professionals to the United States. Central New Jersey is home to the largest population concentration of Telugu people. Telugu people have also settled in New York City and the DC metropolitan area, as well as on the West Coast in Silicon Valley. The New York City and Los Angeles metropolitan areas are home to the largest concentrations of Telugu-speakers.
See also[edit]
- American English
- Language education in the United States
- Language Spoken at Home (U.S. Census)
- List of multilingual presidents of the United States
- Muhlenberg legend
- List of U.S. communities where English is not the majority language spoken at home
- Modern Language Association
General:
- Bilingual education
- Culture of the United States
- Languages of Canada
Notes[edit]
- ^ The United States does not have an official designated language. A bill known as H.R.997—the English Language Unity Act—was introduced in 2017 in an attempt to make English the official language.[1]
References[edit]
- ^ «English Language Unity Act of 2017». Archived from the original on August 3, 2017. Retrieved August 2, 2017.
- ^ «Explore Census Data».
- ^ Siebens, J & T Julian. Native North American Languages Spoken at Home in the United States and Puerto Rico: 2006–2010. United States Census Bureau. December 2011.
- ^ «Census Data Of USA». US Census Bureau. Archived from the original on October 20, 2012. Retrieved August 17, 2012.
- ^ «Detailed Languages Spoken at Home and Ability to Speak English for the Population 5 Years and Over for United States: 2014-2018». census.gov. Archived from the original on October 30, 2020.
- ^ «Selected Social Characteristics in the United States». United States Census Bureau. Retrieved April 16, 2021.
- ^ «American Community Survey, Language Spoken». Retrieved April 13, 2021.
- ^ Grimes 2000
- ^ a b «ACS B16001». ACS B16001. U.S. Census Bureau. Retrieved December 26, 2022.
- ^ Census Bureau Reports at Least 350 Languages Spoken in U.S. Homes, U.S. Census Bureau, November 3, 2015, retrieved July 3, 2018
- ^ At Least 350 Languages Spoken In US Homes: New Report, CNBC, November 4, 2015, retrieved July 3, 2018
- ^ Leeman, Jennifer (2018). «It’s all about English: The interplay of monolingual ideologies, language policies and the U.S. Census Bureau’s statistics on multilingualism». International Journal of the Sociology of Language. 2018 (252): 21–43. doi:10.1515/ijsl-2018-0013. S2CID 149994663.
- ^ Stevens, Gillian (1999). «A Century of U.S. Censuses and the Language Characteristics of Immigrants». Demography. 36 (3): 387–397. doi:10.2307/2648061. JSTOR 2648061. PMID 10472502. S2CID 28315459.
- ^ «Selected Social Characteristics in the United States: 2007». United States Census Bureau. Archived from the original on April 25, 2009. Retrieved October 9, 2008.
- ^ «English Usage Among Hispanics in the United States». Pew Research Center’s Hispanic Trends Project. November 29, 2007. Archived from the original on December 15, 2012. Retrieved January 18, 2015.
- ^ Ancestry: 2000, U.S. Census Bureau, 2000, archived from the original on February 10, 2020
- ^ a b «Language Use and English-Speaking Ability: 2000» (PDF). U.S. Census Brueau. October 2003. Archived (PDF) from the original on February 18, 2008. Retrieved February 22, 2008.
- ^ «EAC Issues Glossaries of Election Terms in Five Asian Languages Translations to Make Voting More Accessible to a Majority of Asian American Citizens». Election Assistance Commission. June 20, 2008. Archived from the original on July 31, 2008. Retrieved January 18, 2015.
- ^ «FYI: English isn’t the official language of the United States». May 20, 2018.
- ^ Crawford, James (February 1, 2012). «Language Legislation in the U.S.A.» languagepolicy.net. Retrieved May 29, 2013.
- ^ «U.S. English Efforts Lead West Virginia to Become 32nd State to Recognize English as Official Language». us-english.org. Archived from the original on April 1, 2016. Retrieved May 13, 2016.
- ^ «States». Englishfirst.org. Archived from the original on February 16, 2017. Retrieved February 5, 2017.
- ^ Crews, Haibert O. (January 23, 1923). «Talk American, Not English». Champaign-Urbana Courier. p. 10. Retrieved March 23, 2021 – via Newspapers.com.
- ^ Davis, Robert (September 24, 1969). «News Briefs: Its Legal—We Speak English». Chicago Tribune. sec. 1, p. 3. Retrieved March 23, 2021 – via Newspapers.com.
- ^ «Alaska’s indigenous languages attain official status» Archived February 12, 2017, at the Wayback Machine, Reuters.com, October 24, 2014. Retrieved October 30, 2014.
- ^ «Bill History/Action for 28th Legislature HB 216». The Alaska State Legislature. Archived from the original on February 4, 2017. Retrieved February 11, 2017.
- ^ Alaska OKs Bill Making Native Languages Official Archived January 20, 2015, at the Wayback Machine April 21, 2014; Bill Chappell; NPR.org
- ^ «South Dakota recognizes official indigenous language». March 25, 2019.
- ^ «48 U.S. Code § 864 – Appeals, certiorari, removal of causes, etc.; use of English language | LII / Legal Information Institute». Law.cornell.edu. Retrieved June 1, 2015.
- ^ Cobarrubias 1983, p. 195.
- ^ García 2011, p. 167.
- ^ James W. Parins (November 4, 2013). Literacy and Intellectual Life in the Cherokee Nation, 1820–1906. University of Oklahoma Press. p. 248. ISBN 978-0-8061-5122-9.
- ^ David W. Voorhees, «Dutch Political Identity in English New York» in Four Centuries of Dutch-American Relations: 1609-2009 (eds. Hans Krabbendam, Cornelis A. van Minnen & Giles Scott-Smith: SUNY Press, 2009), pp. 132-33.
- ^ California Department of Motor Vehicles Website (actual website blocked by Wikipedia)
- ^ America Votes 2006: Key Ballot Issues, CNN, archived from the original on February 9, 2008, retrieved February 22, 2008
- ^ «Arizona Voter Empowerment Card, 2010 Elections» (PDF). American Civil Liberties Union. Retrieved September 3, 2015.
- ^ Heath, Shirley Brice & Frederick Mandabach. Language Status Decisions and the Law in the United States, in Cobarrubias, Juan & Joshua A. Fishman, eds., Progress in Language Planning, p. 94 (1983)
- ^ Sick, Bastian (May 19, 2004). German as the official language of the USA? Archived September 13, 2005, at the Wayback Machine, Spiegel Online (in English)
- ^ Mikkelson, David (2008). German Almost Became Official Language, Snopes
- ^ a b c d e f g h i j k l m n o p q r s t u v w x y z aa ab ac ad ae af ag ah ai aj ak al am an ao ap aq ar as at Crawford, James (June 24, 2008). «Language Legislation in the U.S.A.» languagepolicy.net. Retrieved April 27, 2011.
- ^ «Once forbidden, Alaska’s Native languages now official state languages». KTOO. October 24, 2014. Retrieved October 25, 2014.
- ^ «Alaska State Legislature». www.akleg.gov.
- ^ «Arizona makes English official». Washington Times. November 8, 2006. Retrieved April 28, 2011.
- ^ Constitution of the State of Colorado (2020) – via Wikisource.
- ^ Crawford, James. «Language Policy — Louisiana». Language Legislation in the U.S.A. Retrieved October 10, 2016.
- ^ IT, Missouri Secretary of State — (March 3, 2020). «2008 Ballot Measures». Missouri Secretary of State. Retrieved March 10, 2022.
- ^ «Section I-27, English language to be official». Justia Law. January 24, 2022. Retrieved March 10, 2022.
- ^ «Keetoowah Cherokee is the Official Language of the UKB» (PDF). keetoowahcherokee.org/. Keetoowah Cherokee News: Official Publication of the United Keetoowah Band of Cherokee Indians in Oklahoma. April 2009. Retrieved June 1, 2014.
- ^ «UKB Constitution and By-Laws in the Keetoowah Cherokee Language (PDF)» (PDF). www.keetoowahcherokee.org/. United Keetoowah Band of Cherokee Indians. Retrieved June 2, 2014.
- ^ «The Cherokee Nation & its Language» (PDF). University of Minnesota: Center for Advanced Research on Language Acquisition. 2008. Retrieved May 22, 2014.
- ^ Slipke, Darla (November 3, 2010). «Oklahoma elections: Republican-backed measures win approval». NewsOK. The Oklahoman. Retrieved April 28, 2011.
- ^ «Amendment For Printed Bill». South Dakota Legislature.
- ^ «Official Language Amendments». Bill of 22 March 2021. Utah Legislature.
- ^ «U.S. English Efforts Lead West Virginia to Become 32nd State to Recognize English as Official Language». U.S. English. March 5, 2016. Retrieved March 22, 2016.
- ^ «(Un)Constitutionality of English as the Official Language of the US». Daily Kos.
- ^ Zavodny, Madeline (July 2000). «The Effects of Official English Laws on Limited‐English‐Proficient Workers». Journal of Labor Economics. The University of Chicago Press. 18 (3): 427–452. doi:10.1086/209965.
- ^ «Know Your Rights: Language Access | ohr». ohr.dc.gov.
- ^ ««I Speak» Cards for Language Assistance | ohr». ohr.dc.gov.
- ^ «Samoa now an official language of instruction in American Samoa». Radio New Zealand International. October 3, 2008. Retrieved April 28, 2011.
- ^ «Guam». Encyclopaedia Britannica. October 24, 2018. Retrieved October 25, 2018.
- ^ «Northern Mariana Islands». Encyclopaedia Britannica. October 19, 2018. Retrieved October 25, 2018.
- ^ Crawford, James. «Puerto Rico and Official English». languagepolicy.net. Retrieved April 27, 2011.
- ^ «Frequently Asked Questions». visitusvi.com. United States Virgin Islands. Retrieved April 27, 2011.
- ^ American Samoa Department of Education — Mathematics Content Standards
- ^ «North America :: UNITED STATES». CIA The World Factbook. October 20, 2022.
- ^ Shell, Marc (2001). «Language Wars». CR: The New Centennial Review. 1 (2): 6. doi:10.1353/ncr.2003.0059. ISSN 1539-6630. S2CID 201784628.
- ^ Lake, Nell (March 1, 2002). «Language Wars». Harvard Magazine. Retrieved October 2, 2022.
- ^ Tamir, Yael (Yuli) (May 11, 2019). «Not So Civic: Is There a Difference Between Ethnic and Civic Nationalism?». Annual Review of Political Science. 22 (1): 419–434. doi:10.1146/annurev-polisci-022018-024059. ISSN 1094-2939.
- ^ «Detailed Languages Spoken at Home by English-Speaking Ability for the Population 5 Years and Over: 2011» (PDF). Census.gov. Archived from the original (PDF) on November 9, 2015. Retrieved October 20, 2015.
- ^ «Driver License and Identification Card Information». Dmv.ca.gov. Archived from the original on September 30, 2014. Retrieved January 18, 2015.
- ^ Labov (2006), p. 148.
- ^ Boberg (2001), pp. 24–5.
- ^ Stanford et al. (2014: 120)
- ^ Labov, Ash & Boberg (2006:226)
- ^ Stanford et al. (2012: 160-1)
- ^ Boberg (2001), p. 3.
- ^ «What is the future of Spanish in the United States?». Pew Research Center. September 5, 2013. Archived from the original on January 18, 2015. Retrieved January 18, 2015.
- ^ «The Future of Spanish in the United States». Census.gov. Archived from the original on January 18, 2015. Retrieved January 18, 2015.
- ^ Data Access and Dissemination Systems (DADS). «American FactFinder — Results». Factfinder2.census.gov. Archived from the original on February 12, 2020. Retrieved January 18, 2015.
- ^ «Table 53. Languages Spoken At Home by Language: 2009», The 2012 Statistical Abstract, U.S. Census Bureau, archived from the original on December 25, 2007, retrieved December 27, 2011
- ^ Instituto Cervantes (Enciclopedia del español en Estados Unidos)
- ^ «Más ‘speak spanish’ que en España». Archived from the original on May 20, 2011. Retrieved October 6, 2007.
- ^ Hasselle, Della (October 13, 2018). «Louisiana Joins International Organization of French-speaking Governments». NOLA.com.
- ^ Ammon, Ulrich; International Sociological Association (1989). Status and Function of Languages and Language Varieties. Walter de Gruyter. pp. 306–308. ISBN 978-0-89925-356-5. Archived from the original on December 20, 2012. Retrieved April 23, 2012.
- ^ Valdman, Albert (2009). Dictionary of Louisiana French: As Spoken in Cajun, Creole, and American Indian Communities. University Press of Mississippi. ISBN 978-1604734034.
- ^ Three Local Tribes Await Federal Decision, December 8, 2007, Houma Today.
- ^ Neumann-Holzschuh, Ingrid (2014). «Carrefour Louisiane». Journal of Language Contact. 7 (1): 124–153. doi:10.1163/19552629-00701006.
- ^ Klingler, Thomas A. (2009). «How much Acadian is there in Cajun?». In Mathis-Mosen, Ursula; Beschof, Günter (eds.). Acadians and Cajuns: The politics and culture of French minorities in North America. Innsbruck: Innsbruck University Press. pp. 91–103. ISBN 978-3902571939.
- ^ A., Klingler, Thomas (2003). If I could turn my tongue like that : the Creole language of Pointe Coupee Parish, Louisiana. Baton Rouge: Louisiana State University Press. ISBN 978-0807127797. OCLC 846496076.
- ^ Klingler, Thomas A. (2015). «Beyond Cajun: Toward an Expanded View of Regional French in Louisiana». In Picone, Michael D.; Evans Davies, Catherine Evans Davies (eds.). New Perspectives on Language Variety in the South: Historical and Contemporary Approaches. Tuscaloosa: The University of Alabama Press. pp. 627–640. ISBN 9783110196351.
- ^ Thomas A. Klingler. «Language labels and language use among Cajuns and Creoles in Louisiana.» Ed. T. Sanchez and U. Horesh. Working papers in linguistics 9(2), 2003. 77–90.
- ^ «United States — Selected Population Profile in the United States (German (032-045))». Archived from the original on April 3, 2009. Retrieved November 27, 2008.
- ^ Did Hebrew almost become the official U.S. language?, January 21, 1994, archived from the original on February 13, 2008, retrieved February 22, 2008
- ^ Evgeny Golovko (2010) 143 Years after Russian America: the Russian language without Russians. Paper read at the 2010 Conference on Russian America, Sitka, August 20, 2010.
- ^ Michael Kraus (2016). «IPY-Documenting Alaskan and Neighboring Languages».
- ^ Russian language’s most isolated dialect found in Alaska. Russia Beyond, 2013 May 13.
- ^
Ninilchik Russian (with dictionary) - ^ «Data Center Results». May 25, 2017. Archived from the original on May 25, 2017. Retrieved October 16, 2017.
{{cite web}}: CS1 maint: bot: original URL status unknown (link) - ^ Alice N. Nash; Christoph Strobel (2006), «Daily life of Native Americans from post-Columbian through nineteenth-century America», The Greenwood Press «Daily life through history» series, Greenwood Publishing Group, p. IX, ISBN 978-0-313-33515-0
- ^ a b c «The Cherokee Nation & its Language» (PDF). University of Minnesota: Center for Advanced Research on Language Acquisition. 2008. Archived from the original (PDF) on July 14, 2014. Retrieved May 22, 2014.
- ^ a b Thompson, Irene (August 6, 2013). «Cherokee». Aboutworldlanguages.com/. Archived from the original on May 21, 2014. Retrieved May 22, 2014.
- ^ Joyner, Michael (September 30, 2010). Cherokee Lessons — Introductory Edition. Lulu Enterprises Incorporated. pp. 16–17. Retrieved June 1, 2013.
- ^ «Native American languages». Infoplease.com. Archived from the original on September 24, 2015. Retrieved October 23, 2015.
- ^ Chavez, Will (April 5, 2012). «Immersion students win trophies at language fair». Cherokeephoenix.org. Archived from the original on May 25, 2013. Retrieved April 8, 2013.
- ^ «Native Now : Language: Cherokee». We Shall Remain — American Experience — PBS. 2008. Archived from the original on April 7, 2014. Retrieved April 9, 2014.
- ^ «Cherokee Language Revitalization Project». Western Carolina University. 2014. Archived from the original on April 7, 2014. Retrieved April 9, 2014.
- ^ Hauk, Alexis. «Radio Free Cherokee: Endangered Languages Take to the Airwaves». The Atlantic. Archived from the original on January 16, 2014. Retrieved April 9, 2014.
- ^ «Table 1. Detailed Languages Spoken at Home and Ability to Speak English for the Population 5 Years and Over for the United States: 2006-2008 : Release Date: April, 2010» (XLS). Census.gov. Archived from the original on September 22, 2014. Retrieved January 18, 2015.
- ^ A language’s endonym may not be available for a variety of possible reasons: The language in question encompasses multiple dialects with unique endonyms; The language in question is actually a language family; The language or community of speakers has a prohibition against writing the language; No documentation is immediately available; etc.
- ^ Respondents who reported speaking English less than «Very Well.» The total margin of error for this group was 1.78%; however, margins of error for individual languages, especially those with few total speakers, may exceed 100% in some cases.
- ^ «United States — Languages».
- ^ Jones, Nard (1972). Seattle. Garden City, New York: Doubleday. p. 94 et. seq. ISBN 978-0-385-01875-3.. Quotation is from p. 97.
- ^ «Hawaii Pidgin».
- ^ a b Lewis, M. Paul (2013). Simons, Gary F.; Fennig, Charles D. (eds.). «American Sign Language». Ethnologue: Languages of the World, Seventeenth edition. SIL International. Archived from the original on March 9, 2013.
- ^ a b Paul Preston (1995), Mother father deaf: living between sound and silence, Harvard University Press, p. 243, ISBN 978-0-674-58748-9, archived from the original on January 2, 2016
- ^ Mitchell, Ross E.; Young, Travas A.; Bachleda, Bellamie; Karchmer, Michael A. (2006), «How Many People Use ASL in the United States? Why Estimates Need Updating» (PDF), Sign Language Studies, 6 (3): 306–335, doi:10.1353/sls.2006.0019, S2CID 146557236, archived from the original (PDF) on June 4, 2011
- ^
Clayton Valli; Ceil Lucas (2000), «Sociolinguistic Aspects of the Black deaf Community», Linguistics of American Sign Language: an introduction, Gallaudet University Press, pp. 416–428, ISBN 978-1-56368-097-7, archived from the original on January 2, 2016 - ^ Lambrecht, Linda; Earth, Barbara; Woodward, James (March 3, 2013), History and Documentation of Hawaiʻi Sign Language: First Report, University of Hawaiʻi: 3rd International Conference on Language Documentation and Conservation, archived from the original on March 22, 2013
- ^ Samuel J. Supalla (1992) The Book of Name Signs, p. 22
- ^ Dicker, Susan J. (January 1, 2003). Languages in America: A Pluralist View. Multilingual Matters. ISBN 9781853596513.
chinese.
- ^ a b Lai, H. Mark (2004), Becoming Chinese American or Taiwanese American: A History of Communities and Institutions, AltaMira Press, ISBN 978-0-7591-0458-7
- ^ García, Ofelia; Fishman, Joshua A. (2002), The Multilingual Apple: Languages in New York City, Walter de Gruyter, ISBN 978-3-11-017281-2
- ^ «Czech language» (PDF). U.S. English. Archived from the original (PDF) on March 4, 2012. Retrieved May 11, 2013.
- ^ «Vanishing Voices: Linguists work with remaining speakers of dying languages to preserve cultural memories». University of Texas at Austin. January 11, 2010. Retrieved June 2, 2013.
- ^ «2006 KJT Website Homepage». Archived from the original on January 13, 2012. Retrieved June 2, 2013.
- ^ Cope, Lida. Creating a Digital Archive of Texas Czech: Applied Documentation for the Community, Education, and Research (PDF). Retrieved June 2, 2013.
- ^ Machann, Clinton. «CZECHS». The Handbook of Texas Online. Texas State Historical Association (TSHA). Retrieved June 2, 2013.
- ^ a b c «Detailed Languages Spoken at Home and Ability to Speak English».
- ^ «Dutch : Source: American Community Survey : 5-Year Estimates, Public Use Microdata Sample, 2006–2010». Mla.org. Archived from the original on November 13, 2013. Retrieved January 18, 2015.
- ^ Carlisle, John. «Fortitude, tradition help Finns flourish in brutal U.P.» Detroit Free Press. Retrieved May 10, 2022.
- ^ «Michigan HR0007 | 2017-2018 | 99th Legislature». LegiScan. Retrieved May 10, 2022.
- ^ Eric L. Friedland (1981). «Hebrew Liturgical Creativity in Nineteenth-Century America». Modern Judaism. 1 (3): 323–336. doi:10.1093/mj/1.3.323. JSTOR 1396251.
- ^ «Brandeis University Study Finds that American-Jewish Population is Significantly Larger than Previously Thought» (PDF). February 2, 2007. Archived from the original (PDF) on October 2, 2013. Retrieved November 30, 2013.
- ^ «Language Use in the US 2006–2008 (850k Excel file!)». US Census Bureau. Archived from the original on June 22, 2011. Retrieved June 23, 2011.
- ^ [1] Archived March 25, 2009, at the Wayback Machine
- ^ Bureau, US Census. «More Than 1 Million U.S. Residents Speak Korean at Home». The United States Census Bureau. Retrieved April 22, 2020.
- ^ «American FactFinder — Results». Archived from the original on February 14, 2020. Retrieved July 27, 2016.
- ^ America the diverse: Chicago’s Polish neighborhoods, usaweekend.com, May 15, 2005, archived from the original on December 28, 2017, retrieved July 4, 2008
- ^ a b Biers & Osterhaus 2021, p. 1.
- ^ Tinkler, Jacqueline. «The Walloon Immigrants of Northeast Wisconsin: An Examinatin of Ethnic Retention» (PDF). University of Texas Arlington Libraries Research Commons. Retrieved May 28, 2022.
- ^ Biers & Osterhaus 2021, p. 2.
- ^ «Welsh : Source: Census 2000, Summary File 3». Mla.org. Archived from the original on April 2, 2015. Retrieved January 18, 2015.
- ^ Joshua A. Fishman (1991). «Appendix: The Hebrew Language in the United States». Yiddish: turning to life. John Benjamins Publishing Company. pp. 148–159. ISBN 978-90-272-2075-2. Archived from the original on January 2, 2016.
- ^ Sewell Chan (October 17, 2007), «A Yiddish Revival, With New York Leading the Way», The New York Times, archived from the original on September 30, 2008, retrieved August 15, 2008
+ Patricia Ward Biederman (July 7, 2005), «Yiddish Program Aims to Get Beyond Schmoozing», Los Angeles Times, archived from the original on February 21, 2009, retrieved August 15, 2008
+ Yiddishkayt Los Angeles, yiddishkaytla.org, archived from the original on July 24, 2008, retrieved August 15, 2008 - ^ Bureau, U. S. Census. «American FactFinder — Results». factfinder.census.gov. Archived from the original on July 14, 2018. Retrieved August 30, 2019.
- ^ Shankar, Shalini (2008). «Speaking like a Model Minority: «FOB» Styles, Gender, and Racial Meanings among Desi Teens in Silicon Valley». Journal of Linguistic Anthropology. 18 (2): 268–289. doi:10.1111/j.1548-1395.2008.00022.x.
- ^ Shankar, Shalini (2010). «Reel to real». Pragmatics. 14 (2–3): 317–335. doi:10.1075/prag.14.2-3.12sha.
- ^ See «School offers Tamil language classes» Sentinel Sept. 4, 2014 Archived March 15, 2016, at the Wayback Machine
- ^ Vasudha Narayanan, «Tamils» in David Levinson and Melvin Ember, eds. American immigrant cultures: builders of a nation (1997). p. 878.
- ^ US Census 2006-2008 American Community Survey See Row# 125
- ^ «About FETNA». Federation of Tamil Sangams of North America. Archived from the original on January 16, 2013. Retrieved April 1, 2013.
- ^ «Yearbook of Immigration Statistics: 2012 Supplemental Table 2». U.S. Department of Homeland Security. Retrieved March 31, 2013.
- ^ «Yearbook of Immigration Statistics: 2011 Supplemental Table 2». U.S. Department of Homeland Security. Retrieved March 31, 2013.
- ^ «Yearbook of Immigration Statistics: 2010 Supplemental Table 2». U.S. Department of Homeland Security. Retrieved March 31, 2013.
- ^ a b Kirk Semple (June 8, 2013). «Sri Lankans have gathered on Staten Island,…» The New York Times. Archived from the original on October 5, 2013. Retrieved June 9, 2013.
- ^ «Why Staten Island?». Little Sri Lanka. Retrieved July 25, 2015.
- ^ New Jersey Tamil Sangam Archived September 2, 2010, at the Wayback Machine
- ^ Bay Area Tamil Manram Archived October 27, 2010, at the Wayback Machine
- ^ «Yearbook of Immigration Statistics: 2012 Supplemental Table 2». U.S. Department of Homeland Security. Archived from the original on April 3, 2013. Retrieved March 31, 2013.
- ^ «Yearbook of Immigration Statistics: 2011 Supplemental Table 2». U.S. Department of Homeland Security. Archived from the original on August 8, 2012. Retrieved March 31, 2013.
- ^ «Yearbook of Immigration Statistics: 2010 Supplemental Table 2». U.S. Department of Homeland Security. Archived from the original on July 12, 2012. Retrieved March 31, 2013.
- ^ «Why Staten Island?». Little Sri Lanka. Archived from the original on July 26, 2015. Retrieved July 25, 2015.
- ^ «Table 1. Detailed Languages Spoken at Home». Archived from the original on June 4, 2011.
Bibliography[edit]
- Campbell, Lyle. (1997). American Indian languages: The historical linguistics of Native America. New York: Oxford University Press.
- Campbell, Lyle; & Mithun, Marianne (Eds.). (1979). The languages of native America: Historical and comparative assessment. Austin: University of Texas Press.
- Grimes, Barbara F. (Ed.). (2000). Ethnologue: Languages of the world, (14th ed.). Dallas, TX: SIL International. ISBN 1-55671-106-9. Online edition: http://www.ethnologue.com/, accessed on December 7, 2004.
- Mithun, Marianne. (1999). The languages of native North America. Cambridge: Cambridge University Press.
- Zededa, Ofelia; Hill, Jane H. (1991). The condition of Native American Languages in the United States. In R. H. Robins & E. M. Uhlenbeck (Eds.), Endangered languages (pp. 135–155). Oxford: Berg.
Further reading[edit]
- Blatt, Ben. «Tagalog in California, Cherokee in Arkansas.» Slate. May 13, 2014.
External links[edit]
- Bilingualism in the United States
- Detailed List of Languages Spoken at Home for the Population 5 Years and Over by State: U.S. Census 2000
- Foreign Languages in the U.S. About foreign languages and language learning in the United States
- How many indigenous American languages are spoken in the United States? By how many speakers? Archived July 23, 2017, at the Wayback Machine
- Native Languages of the Americas
- Ethnologue report for USA
- Linguistic map of the United States of America
- Modern Language Association Language Map
English is far and away the most spoken language in the United States, and is used in nearly all government institutions and functions. However, contrary to what many might believe, English is not the official language of the country, nor is any other language for that matter. While many individual states have given the English language official status, it is not granted that distinction at the federal level, largely because the American forefathers feared that by doing so they might infringe on other people’s liberties.
There can be no debate that the United States is one of, if not the most diverse nation on the planet; a nation formed of immigrants from every corner of the earth. As a result, America is now home to over 300 different languages, including English, ranging from Afrikaans to the native language known as Zoogocho Zapotec. To illustrate this incredible diversity, in the following article we will take a closer look at the languages of the United States, including a breakdown of some of the languages frequently spoken at home by Americans, some information regarding U.S. language policy and a description of four of the most commonly used languages in the country, including English.
United States Languages: Languages of Today
 English news paper from 1776
According to the United States Census Bureau, English is the most predominant language spoken in the United States. Of the roughly 292 million people in the United States ages 5 and older, a whopping 231 million of them, or 79 percent, speak English only at home. Twenty-one percent of the population, or roughly 61 million people, speak a language other than English (as their first language).
Spanish tops the list as the most oft spoken non-English language in the United States, accounting for 62 percent of all foreign language speakers, or a total of 38 million people.
Other languages spoken in the United States, listed in order of prevalence, include Chinese (4.8 percent of the population), Tagalog (2.6%), Vietnamese (2.3%), French (2.1%), Korean (1.9%), German (1.8%), Arabic (1.6%), Russian (1.5%), African Languages (1.5%), Other Asian languages (1.4%), Italian (1.2%), French Creole (1.2%), Portuguese (1.1%) and Hindi (1.1%).
Because of the large number of languages spoken in the United States, the Census Bureau has created four distinct linguistic groups, which together cover the entirety of speakers in America. These four groups include:
Spanish
The “Spanish” language group includes Spanish, Spanish Creole and Ladino.
Other Indo-European Languages
This category includes all other Indo-European languages spoken in the United States, including most languages of Europe and the Indic languages of India. In this group you’ll find the Germanic languages, such as German, Dutch and Yiddish; the Scandinavian languages, such as Swedish, Norwegian and Finnish; the Romance languages, such as French, Italian, and Portuguese; the Slavic languages, such as Polish, Russian, and Serbo-Croatian; the Indic languages, such as Hindi, Gujarati, Punjabi and Urdu; the Celtic languages; Greek; the Baltic Languages and the Iranian languages.
Asian and Pacific Islander Languages
The Asian and Pacific Islander language group includes the following languages: Chinese, Korean, Vietnamese, Japanese, Hmong, Khmer, Lao, Thai, and Tagalog or Pilipino. It also includes the Dravidian languages of India, such as Telugu, Tamil and Malayalam; and other languages of Asia and the Pacific including the Philippine, Polynesian, and Micronesian languages.
All Other Languages
This final category includes all languages not covered in the first three. This includes the Uralic languages, such as Hungarian; the Semitic languages, such as Arabic and Hebrew; the languages of Africa; native North American languages, including the American Indian and Alaska native languages; and the indigenous languages of Central and South America.
United States Language Policy
Throughout the course of United States history there have been many efforts geared towards making English the official language of the country. Some of these plans have even suggested “recognizing” one or two other languages based on their prevalence, or the number of speakers. These efforts, at least at the federal level, have never quite been successful. While it’s true that the country does conduct all of its official business in English, the sheer linguistic diversity of America makes it difficult to do anything more in terms of policy.
Simply put, creating a coherent language policy for the United States is not, nor has it ever been an easy proposition. In total, there are over 300 languages spoken in the United States, and while today Spanish is by far the most prevalent non-English language, this has not always been the case. Over the course of American history, many languages have risen to the rank of “most important foreign language to know.” 100 years ago, for example, this title was bestowed on German, and in subsequent years, the spotlight moved to French, then Japanese. Tomorrow it could be Arabic or Chinese that becomes the “language to know.”
Regardless, of prevalence, the truth is that America has never been a land of just two or three languages, not even at the regional level. Non-English speakers—speakers of 321 languages at present—are not evenly distributed within the United States, leaving each state, county and metropolitan region with its own linguistic composition. The scope of these differences illustrates the “slippery slope” of merely concentrating on a second or third language when creating language policy. Linguistic differences in the United States encompass far more than even the most ambitious efforts could satisfy.
State by State Language Policy
 Spanish teacher protest
There are many individual states within America that have passed legislation naming English as the official language. This does not mean, however, that they can simply ignore those people who speak something other than English. All schools, for example, regardless of the state, must have programs in place to cater to non-English speaking students, and California, one of the most diverse states in the union—one that has, ironically, named English as the official language—prints most of its government documents and brochures in over 30 different languages.
The states in which English is now the official language slightly outnumber those that have yet to take this step. These states include Alabama, Alaska, Arizona, Arkansas, California, Colorado, Florida, Georgia, Hawaii, Idaho, Illinois, Indiana, Iowa, Kansas, Kentucky, Mississippi, Montana, Nebraska, New Hampshire, North Carolina, North Dakota, Oklahoma, South Carolina, South Dakota, Tennessee, Utah, Virginia, and Wyoming. Some of these states, as well as a few that have not made English official, give special status to other languages as well. In Hawaii, for example, the Hawaiian language is recognized, while in parts of Louisiana, French has had special status since 1968. Spanish has special status in New Mexico (as granted in 1912), as well as in the United States territory of Puerto Rico, where Spanish is the most commonly spoken language.
About the Languages in the United States
Below we will take a closer look at the four most prevalent languages in the United States, beginning with English:
English
English is spoken as the first (and often only) language by 79 percent of the population. English also serves as the de facto official language of the United States—the language in which the business of government is carried out.
Although English was inherited in America by British colonization, over time, American English has become very different than that of the UK. This includes differences in grammar, pronunciation, spelling and slang usage. These variances do not typically represent a barrier to effective communication between an American English speaker and British speaker, but they are overt enough to cause occasional misunderstandings, particularly with regard to slang and regional dialect differences.
Spanish
The most prominent non-English language in the United States, Spanish is spoken as a first language by approximately 38 million American residents. Like English, it was inherited from the Spanish colonization and is given special status in some US states and territories, including New Mexico and Puerto Rico.
In many schools throughout the nation, Spanish is taught as a second language, usually beginning in secondary school, but sometimes even earlier in areas with substantial Hispanic populations. Children and adults alike are learning Spanish at record rates in the United States, seeing it as an opportunity to better communicate with the large and ever-growing Spanish-speaking population.
Large Spanish speaking populations can be found in the American Southwest—places such as New Mexico, Arizona and Texas that are near the Mexican border. Spanish speakers are also very prevalent in the states of California, Florida, New York, New Jersey and the District of Colombia. Throughout these regions (and many others), it is not uncommon to see signs, pamphlets and other forms of media written in both Spanish and English. Churches in these regions often offer both an English and Spanish-speaking service, especially the Catholic Church, to which many Spanish speakers belong. Children in school have the opportunity to learn English as a second language, through ESL programs that are designed to help them assimilate. The Spanish-speaking communities of the United States are so vast in number, that the country is now the fifth-largest Spanish speaking country in the world, trailing only Mexico, Spain, Colombia and Argentina.
Chinese
 International District in Seattle WA
Chinese, largely the Cantonese variety of the language, is the third-most spoken language in the United States. The language is spoken almost wholly within the Chinese American and Taiwanese American populations, and by immigrants or the descendants of immigrants, particularly in the western state of California.
Because of the recent rise of Chinese speakers and China’s rapidly growing economy, the Chinese language, specifically the Mandarin variety—the official spoken language of the People’s Republic of China—is being studied by American students, young and old. Today there are nearly 3 million Americans who speak some variety of Chinese, with the Mandarin variety becoming more and more common since the opening up of China.
Tagalog
Tagalog, a language of the Philippines, is the fourth-most spoken language in the United States. This language, along with its standardized form Filipino, is spoken by almost 2 million Filipino Americans, and is heavily promoted by Filipino American civic organizations and Philippine consulates. As Filipinos became the fastest growing Asian population in the United States (after China), the Tagalog language rapidly became the second-most spoken Asian language in the country. Today, there are many students majoring in Tagalog in America’s universities, including the University of Hawaii and University of California, where Tagalog-speaking populations are significant.
Following the American annexation of the Philippines, the number of Tagalog speakers gradually increased, as students and laborers migrated to the United States to find better opportunities. Upon Philippine independence, however, their numbers decreased somewhat, as many of them were repatriated.
Records show that Tagalog speakers arrived in the United States as early as the late sixteenth century. Many worked as sailors for the Spanish colonial government, and by the eighteenth century they had established settlements in places like Louisiana (Saint Malo).
English is the most common language in the United States of America, which makes it the de facto national language. But is it the official language of the USA? Does the country even have one? What is an official language, and which languages have that status in the United States? We’ll answer these questions and address some facts and fiction surrounding them.
Start your journey to reach fluency
Official languages in the USA
What is an official language?
The term official language does not describe the language spoken by majority in a country, region, or state. It refers to the government or state language as it is used in judication, legislation and administration. Around 180 countries in the world have an official language and more than one hundred recognise more than one official language. However, the USA is part of neither group.
Read more about the differences between American, British, and Australian English.
US states with official languages
The United States of America doesn’t have an official language on the federal level. They do use English as the primary language for official documents and publications, legislation, orders, regulations and rulings. Yet state laws govern dual-language situations and can require the printing of documents in more than one English, for example English and Spanish or even French.
A number of states have established English as the only official language on a state level, while other states recognise English alongside native languages. 30 US states have made English the only official language, while Hawaii recognises Hawaiian alongside English and Alaska has many official native languages.
The 30 states with English as the only official language are:
Alabama, Alaska, Arizona, Arkansas, California, Colorado, Florida, Georgia, Hawaii, Idaho, Illinois, Indiana, Iowa, Kansas, Louisiana, Massachusetts, Mississippi, Missouri, Montana, Nebraska, New Hampshire, North Carolina, North Dakota, South Carolina, South Dakota, Tennessee, Utah, Virginia and Wyoming.
All US territories have official languages. Puerto Rico has declared Spanish the principal language, but both English and Spanish are official languages. In the US Virgin Islands, only English is official, while American Samoa has English and Samoan. Guam has English and Chamorro has official languages and in the Northern Mariana Islands, English, Chamorro and Carolinian are official.
Start your journey to reach fluency
The English Language Unity Act
The English Language Unity Act is a bill seeking to establish English as the US official language on the federal level. Its first version was introduced in 2005 and would require functions, proceedings and publication of federal and state government to be in English.
The bill never became law, though it passed the House of Representatives in 1999. In 2005, a version garnered 164 sponsors in the House, but the bill died then and again in 2007 with 153 cosponsors. In 2017, House Resolution 997 had the support of 73 representatives. Its senate companion bill had seven senators supporting it, again not enough to pass into law.
To this day, there is no federal law in the United States of America declaring English or any other language as official on a national level.
How many people speak English and where is it spoken?
The German myth
According to an urban legend, in 1776, a decision to make German instead of English the official language of the USA hinged on only one vote. This is a myth, but it has various kernels of truth.
Roughly 17% of US-Americans have German forefathers. And there was a vote with a close result, but it didn’t happen in 1776, and it wasn’t on any official language. In 1795, following Congressional debate, a vote ended 42 to 41 against publishing US laws translated into German or languages other than English.
Find out about the biggest differences between America and Germany!
Most common languages in the USA
According to data based on research by the American Community Survey and published by the US Census Bureau, these are the most common languages spoken in the USA: between 290 and 300 million people speak English, while around 230 to 235 million only speak English at home. Around 60 million speak a language other than English at home.
Top 10 most common languages in the USA
The top ten common languages spoken in the USA are:
- English: 290-300 million speakers (230-235 English only)
- Spanish: ~42 million speakers
- Chinese (incl. Mandarin, Cantonese and Hokkien): ~3.5 million speakers
- Tagalog (incl. Filipino): ~1.75 million speakers
- Vietnamese: ~1.5 million speakers
- Arabic: ~1.25 million speakers
- French: ~1.2 million speakers
- Korean: ~1.1 million speakers
- Russian: ~0.95 million speakers
- German: ~0.92 million speakers
US indigenous languages
The Cherokee Nation in Oklahoma recognises Cherokee as the official language with around 12,000 speakers. Likewise, indigenous languages are official or co-official on many of the US Indian reservations.
Navajo is the most common of the native American languages with around 166,000 speakers who mostly live in Arizona, New Mexico and Utah. All other indigenous North American languages combined have 197,000 speakers, with Yupik, Dakota, Apache, Keres, Cherokee, Ojibwa, Choctaw and Zuni being among the most common languages.
Interested in American culture? We’ll tell you how formal or informal people in the USA are!
Start your journey to reach fluency
Jakob is a freelance writer in Barcelona, Spain, and his favorite books have pages all empty. As an expert storyteller, he publishes creative fiction in English and German and helps other authors shape their manuscripts into compelling stories. Thanks to an expertise in a wide range of topics such as writing, literature and productivity to marketing, travel, and technology, he produces engaging content for his clients. Apart from the escape that books offer, Jakob enjoys traveling digital nomad style and stays active with climbing and hiking. Find out more about him on his website, Twitter or on Goodreads.